

A report from the Mortgage Bankers’ Association (MBA) says that originations of multifamily mortgages in Q2 were up 24 percent on a year-over-year basis, outpacing the 19 percent rise in commercial/multifamily mortgages generally.
Tracking multifamily mortgage originations
The first chart, below, shows the quarterly origination volume indices since Q1 2018 for both commercial mortgages and for multifamily mortgages as reported by the MBA. The indices are reported relative to the year 2001, with the average quarterly volume in that year defined as a value of 100.
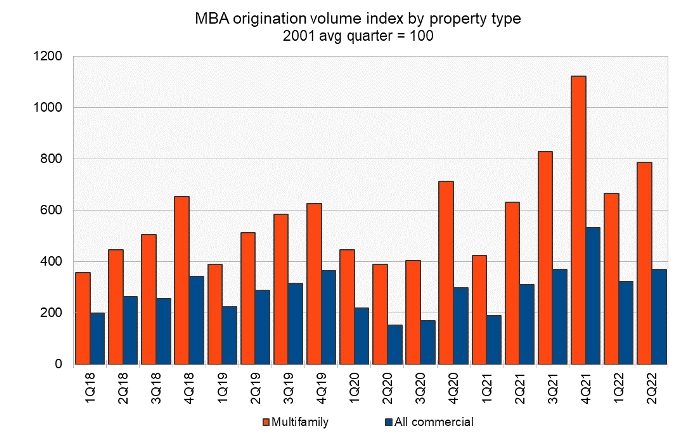
After the strongly seasonal pattern of mortgage origination volumes was disrupted during the pandemic year of 2020, it has reasserted itself over the last 6 quarters. While the average rate of year-over-year increase in multifamily mortgage originations was around 16 percent in the 3 years prior to 2020, the rates of year-over-year increase in multifamily mortgage originations so far in 2022 have been 57 percent in Q1 and 24 percent in Q2.
The year-over-year rate of growth in multifamily mortgage originations was exceeded by the rates of increase for mortgage originations for retail properties (108 percent) and for hotel properties (37 percent). However, it exceeded the rates of growth in originations for industrial properties (3 percent), health care properties (-3 percent) and office properties (-11 percent).
Sources of funds
The MBA report also includes data on the sources of the commercial mortgages being originated. However, this section of the report does not break out multifamily mortgage originations from lending on other types of commercial real estate.
The report provides data on five categories of commercial mortgage lenders: commercial mortgage-backed securities (CMBS) and conduits, depositories (formerly called commercial banks), life insurance companies, the government sponsored entities (GSEs), Fannie Mae and Freddie Mac, and investor-driven lenders such as REITs and specialty finance companies. The index values are quoted relative to the average quarterly origination volumes in the year 2001. The index values of different originators cannot be used to compare their absolute levels of mortgage originations since their origination levels in the baseline year of 2001 were different. To gain insight into the absolute levels of funding provided by the different classes of originators, readers should look to the MBA’s report on mortgage debt outstanding. However, the origination index values can be compared to see which classes of originators are growing their business and which are not.
In the next chart, below, the seasonality in the data is less clearly visible than in the first chart, but the tendency for originations to be lower in Q1 than in Q4 is apparent for depositories, life insurers and investor-driven entities.
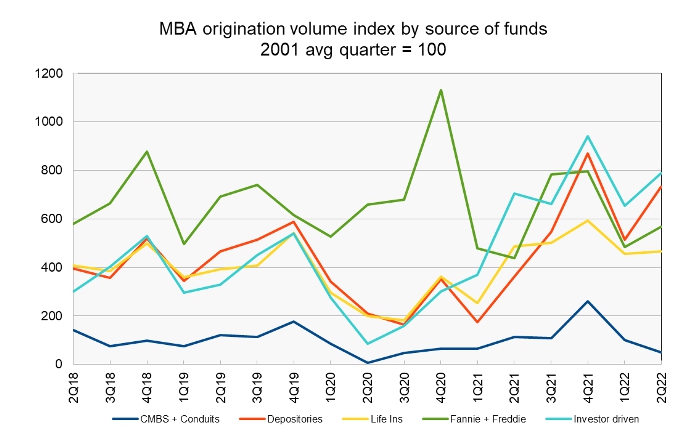
After the falloff in Q1, originations rebounded in Q2 for most classes of originators with the exception of CMBS & conduits. On a year-over-year basis, originations were up 103 percent for depositories and 29 percent for the GSEs. the two largest sources of commercial mortgage funds. Investor-driven entities increased originations 12 percent while life insurers reduced originations 5 percent and CMBS & conduits decreased originations 57 percent.
The full report from the MBA includes additional information on lending for other commercial property types. It can be found here.


