

The latest rent report from Apartment List shows that the national average rent growth rate fell in August. Rent growth was 0.5 percent month-over-month and 10.0 percent year-over-year. These rates are down from the 1.0 percent MoM and 12.3 percent YoY rates posted last month. The year-over-year rent growth rate has been declining since reaching a recent high in December 2021.
The pattern of rent growth
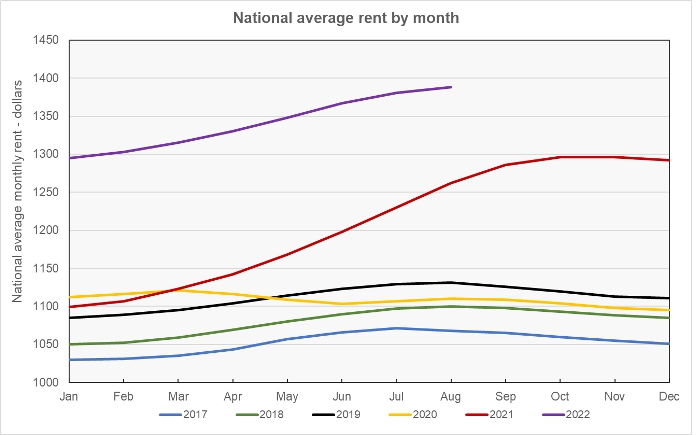
The first chart shows the history of the national average rent level since 2017. It is plotted year-by-year so that the annual change pattern is visible. This chart is provided as a reference for comparison with the additional charts below.
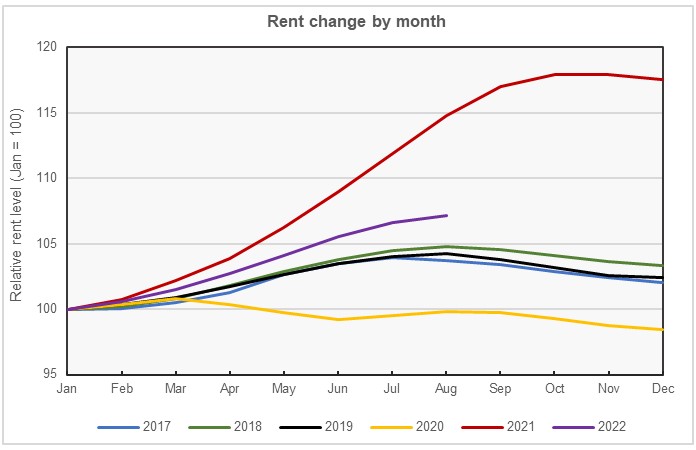
The next chart shows the relative rent change by month for each year in the Apartment List data set, with the level of rent set to 100 in January of each year. This chart shows the annual pattern of rent changes was very consistent in the pre-pandemic years 2017-2019. However, the rent growth pattern deviated strongly to the downside in 2020 and strongly to the upside in 2021. So far, the rent growth pattern in 2022 is somewhere in between, although it is closer to the pre-pandemic pattern than it is to the pattern of 2021.
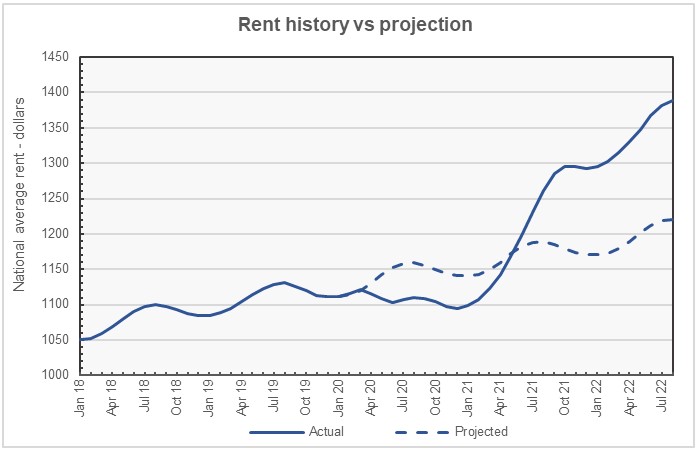
The history of rent changes for the last 4+ years is shown in the next chart, below, along with a projection of where rents would be if the pattern of growth that existed before the pandemic had continued. By this estimate, rents are now about $168 per month (14 percent) above where they would have been if they had followed the prior trend.
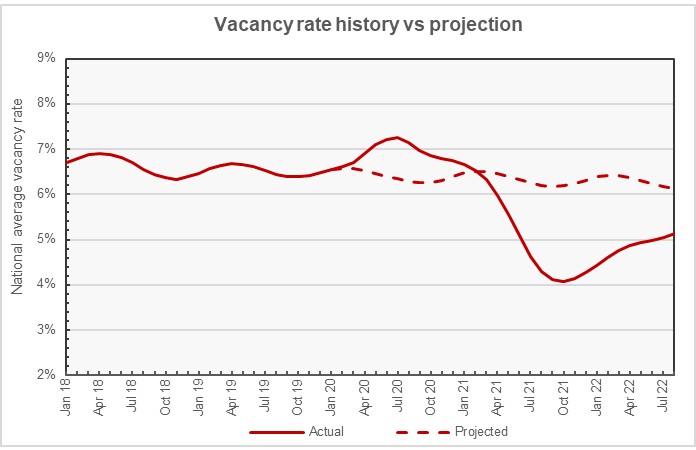
Apartment List’s vacancy rate data was used to create the next chart, below. This chart plots the national vacancy history since January 2018 along with a projection of how the vacancy rate history would have unfolded after February 2020 if it had followed the seasonal pattern from 2018 and 2019. The chart shows that the national average vacancy rate has recently been rising and closing the gap with the long-term trend line. However, the current gap between the predicted and actual vacancy rates is 1 percentage point, 6.1 percent to 5.1 percent.
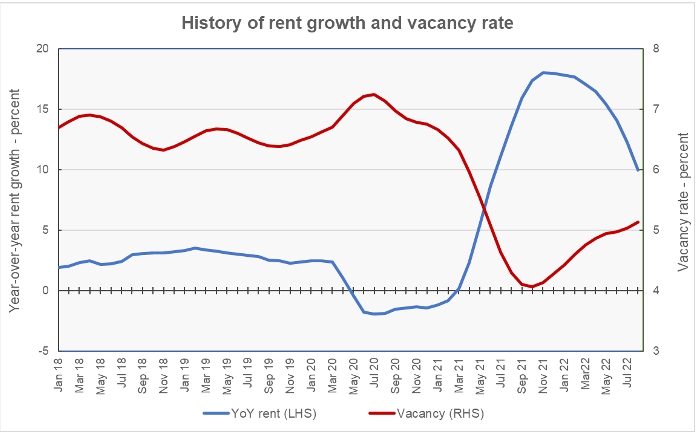
The final chart shows the year-over-year rate of rent growth since January 2018 plotted along with the national average apartment vacancy rate. It shows the two metrics moving in opposite directions after March 2020. Both metrics are moving in the direction of their pre-pandemic averages, but they have recovered only about half of their deviations from trend.
Leaders and trailers
Apartment List provides the underlying data they collected in compiling their report and that data was used to create the tables, below. The tables look at the 52 metropolitan statistical areas defined by the US Census Bureau with populations over 1 million and identify the top and bottom 10 metros for year-over-year rent growth. The tables provide the average monthly rent in the metro, the metro’s vacancy rate, the annual percentage change in rent (YoY Metro) along with the percentage change from the prior month’s rent level (MoM Metro). They also list the percentage change in rent for the metro area compared to the rent level in February 2020, right before the pandemic struck (Feb 20).
The first table shows the 10 metros with the largest annual rent percentage increases. Of these metros, only Miami saw its rent fall month-over-month in August.
| Metro | Metro Rent | Vacancy | YoY Metro | MoM Metro | Feb 20 |
| Orlando | $1,710 | 4.9 | 16.0 | 0.2 | 35.8 |
| San Diego | $2,444 | 3.3 | 15.9 | 0.8 | 35.6 |
| Miami | $2,065 | 5.0 | 15.8 | -0.2 | 36.9 |
| New York | $2,125 | 3.5 | 15.8 | 0.9 | 21.5 |
| Tucson | $1,364 | 6.1 | 15.2 | 1.2 | 41.6 |
| Charlotte | $1,475 | 5.8 | 14.3 | 0.6 | 30.8 |
| Nashville | $1,523 | 5.5 | 14.1 | 0.4 | 30.4 |
| Rochester, NY | $1,366 | 4.9 | 13.4 | 0.2 | 47.4 |
| Dallas | $1,505 | 5.9 | 13.1 | 0.5 | 27.9 |
| Cincinnati | $1,142 | 3.1 | 12.6 | 0.6 | 27.5 |
The next table shows the 10 metros with the smallest annual rent increases. While only one metro saw its rent level decline month-over-month in July, this month 4 metros did. This may indicate that rent growth is returning to its pre-pandemic pattern where rent growth trends downward in the last half of the year.
| Metro | Metro Rent | Vacancy | YoY Metro | MoM Metro | Feb 20 |
| Sacramento | $1,781 | 4.2 | 3.4 | -0.1 | 27.1 |
| Minneapolis | $1,235 | 6.6 | 3.7 | -0.1 | 5.7 |
| Virginia Beach | $1,620 | 3.9 | 4.9 | 0.7 | 27.6 |
| San Francisco | $2,188 | 5.0 | 4.9 | 0.3 | 0.8 |
| Baltimore | $1,657 | 4.4 | 4.9 | 0.1 | 21.0 |
| Detroit | $1,187 | 4.2 | 5.6 | 0.0 | 22.2 |
| Memphis | $1,259 | 5.2 | 6.1 | 0.0 | 31.3 |
| Phoenix | $1,652 | 5.8 | 6.6 | -0.1 | 35.5 |
| Riverside | $2,001 | 3.6 | 6.6 | 0.0 | 38.4 |
| Hartford | $1,484 | 3.7 | 6.6 | -0.1 | 26.0 |
The complete Apartment List report covers many more metros. It also provides readers with the opportunity to download their data sets. It can be found here.


