

The Census Bureau’s report on construction spending shows that the value of multifamily residential construction put in place in August was up 0.4 percent month-over-month despite overall residential construction spending falling by 1.0 percent.
Multifamily construction spending remains firm
The reported value of total private residential construction put in place in August 2022 was $912.9 billion on a seasonally adjusted, annualized basis. This figure, which includes spending on both new construction and on improvements, was reported to be down $8.7 billion from July’s revised figure. Residential construction spending was up 12.5 percent year-over-year.
The value of new private construction of multifamily residential buildings put in place in August was reported to be $101.2 billion on a seasonally adjusted, annualized basis. This was reported to be up $387 million from the revised (+$378 million) level for July. The value of multifamily housing construction put in place in August 2022 was 0.2 percent lower than the level of August 2021.
By comparison, the Census Bureau’s New Residential Construction report said that the number of unit completions in August in buildings with 5 or more units was down 21 percent for the month and down 7 percent year-over-year.
State and local governments were reported to have put $9.1 billion in residential construction in place in August on a seasonally adjusted annualized basis.
The value of new single-family residential construction put in place in August was $436.0 billion on a seasonally adjusted, annualized basis. This was down $13.1 billion (2.9 percent) from the revised (-$0.9 billion) level for July and was down 0.1 percent from the level of August 2021.
The value of improvements to residential buildings put in place in August was reported to be $375.6 billion on a seasonally adjusted, annualized basis. This was up 37.3 percent from the year-earlier level and was up 1.1 percent from the revised (+$1.7 billion) level for July. The Census Bureau does not separate out improvements for single-family and multifamily residential buildings.
Charting the data
The following chart shows the value of residential construction put in place each month since January 2001.
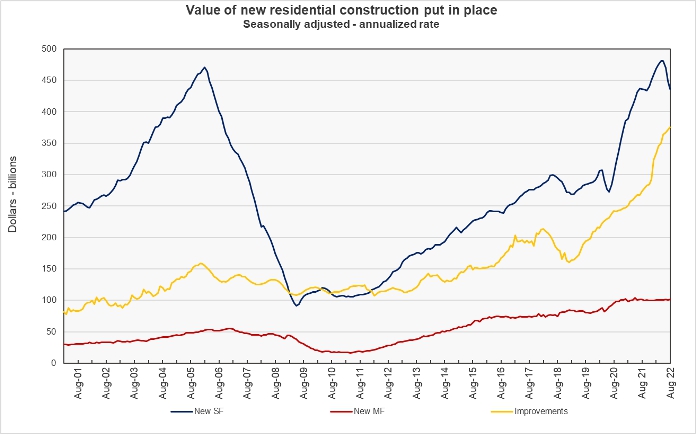
The chart shows that the value of multifamily residential construction put in place has been fairly steady since late 2020 when it first hit the $100 million level. By contrast, single-family residential construction spending hit a recent high in April and is now down 9.4 percent from that month’s level.
Spending on improvements has been the bright spot in residential construction. It continues to rise even as overall residential construction spending is declining. Residential improvement spending is now nearly 2.5 times the peak level it reached in 2005 during the housing bubble.
The report from the Census Bureau also includes information on spending on other types of construction projects. The full report can be found here.


