

A report from the Mortgage Bankers’ Association (MBA) says that originations of multifamily mortgages in Q3 were down 16 percent on a year-over-year basis. Originations of all commercial mortgages as a single asset class fell 13 percent.
Tracking multifamily mortgage originations
The first chart, below, shows the quarterly origination volume indexes since Q1 2018 for both commercial mortgages and for multifamily mortgages as reported by the MBA. The indexes are reported relative to the year 2001, with the average quarterly volume in that year defined as a value of 100.
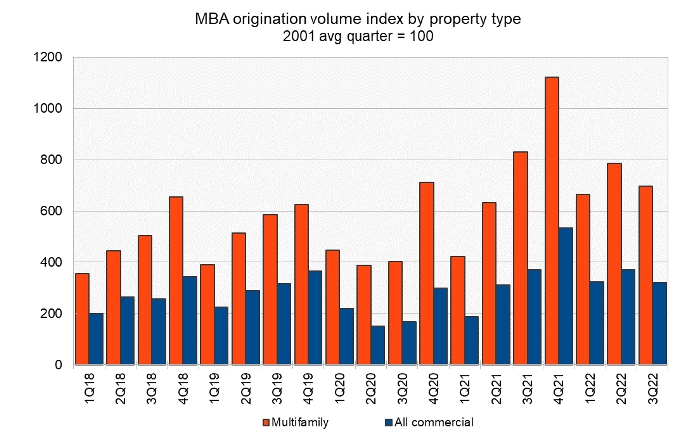
Excepting the pandemic year of 2020, the mortgage origination volume data exhibited a strong seasonal pattern of progressively higher originations quarter to quarter through the year. The 2022 results deviate from that pattern with declines in originations of both multifamily and commercial mortgages from Q2 to Q3.
Of the six property categories mentioned in the report (multifamily, office, retail, industrial, hotel and health care), only hotel saw higher originations in Q3 than in Q2. However, hotel was the asset class with the greatest drop in originations during the pandemic and its aftermath, even more than retail. While hotel originations were up quarter-over-quarter and year-over-year, they were still down 27 percent from their level in Q3 2019, before COVID.
Sources of funds
The MBA report also includes data on the sources of the commercial mortgages being originated. However, this section of the report does not break out multifamily lending from lending on other types of commercial real estate.
The report provides data on five categories of lenders: commercial mortgage-backed securities (CMBS) and conduits, depositories (aka commercial banks), life insurance companies, the government sponsored entities (GSEs), Fannie Mae and Freddie Mac, and investor-driven lenders such as REITs and specialty finance companies.
The index values are quoted relative to the average quarterly origination volumes in the year 2001. The index values of different originators cannot be used to compare their absolute levels of mortgage originations since their origination levels in the baseline year of 2001 were different. To gain insight into the absolute levels of funding provided by the different classes of originators, readers should look to the MBA’s report on mortgage debt outstanding. However, the origination index values can be compared to see which classes of originators are growing their business and which are not.
The history of the origination indexes for the different classes of lenders is shown in the next chart, below.
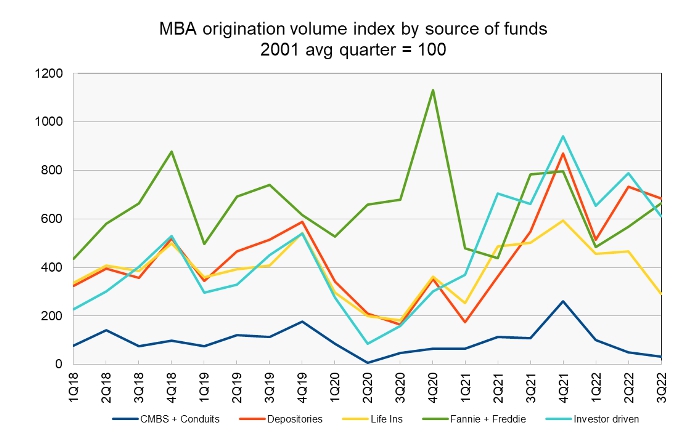
Of the five categories of lenders, only the GSEs increased their originations quarter-over-quarter in Q3, with their originations growing by 17 percent. Declines in originations were largest for life insurers and for CMBS at about 37 percent each. Issuance by investor-driven lenders fell 22 percent while issuance by depositaries fell by 7 percent.
On a year-over-year basis, only depositaries increased their mortgage issuance with a rise of 25 percent. Issuance fell 71 percent for CMBS, 42 percent for life insurers, 15 percent for GSEs and 8 percent for investor-drive lenders.
The full report from the MBA includes additional information on lending for other commercial property types. It can be found here.


