

The Census Bureau released its quarterly report on home ownership and occupancy for Q3 2022. It showed that the rental housing vacancy rate was 6.0 percent, up from a level of 5.6 percent in Q2 2022 and from a level of 5.8 percent in Q3 2021.
Different looks at vacancies
The headline vacancy rate reported by Census, 6.0 percent in Q3, is for all rental housing in the country, both single-family and multifamily. Census breaks down this figure based on various characteristics, including by the number of units in the building. The chart, below, illustrates this comparison.
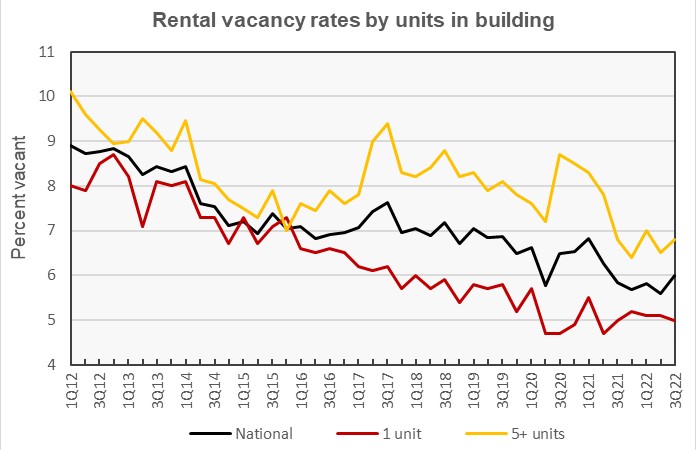
The chart shows that single family rentals have generally had lower vacancy rates than have multifamily rentals and that pattern continued this quarter. The difference in vacancy rates between the two classes of housing widened significantly after the 2007 housing crash.
By the numbers, the single-family rental vacancy rate was 5.0 percent in Q3 2022, down 0.1 percentage points from last quarter and the same level as in Q3 2021. The rental vacancy rate for units in buildings with 5 or more units was 6.8 percent in Q3 2022, up from 6.5 percent in Q2 2022 and also unchanged from the level in Q3 2021.
The rental vacancy rate in the core cities of the Census Bureau’s Metropolitan Statistical Areas (MSAs) was 6.5 percent in Q3 2022, up from 5.8 reported for the previous quarter. The rental vacancy rate in the suburbs of the MSAs was 5.3 percent in Q3 2022. This ticked up from the 5.2 percent rate reported in Q2.
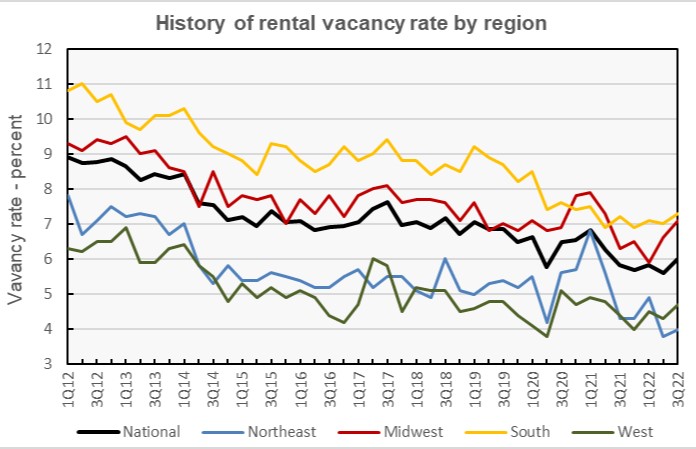
The rental vacancy rate history for each of the Census regions is shown in the next chart, below. The data is “noisy” with seemingly random quarter to quarter variations, those variation appear on top of a trend toward lower vacancy rates. However, it is perhaps significant that all four Census regions saw vacancy rates rise in Q3. The size of the rise varied from 0.2 percentage points in the Northeast to 0.5 percentage points in the Midwest.
Census reported that 68 percent of vacant rental units were in structures with 2 or more units. Only about 14 percent of the vacant multifamily units had 3 bedrooms, with 1 bedroom units comprising 41 percent and 2 bedroom units comprising 43 percent of vacant stock. The median unit vacancy duration for multifamily properties in Q3 2022 was 2.0 months, down from 2.3 months one year earlier.
Tracking rentership
The Census Bureau reported that 34.0 percent of the country’s 128,307,000 occupied housing units were inhabited by renter households in Q3 2022. This rate is down slightly from that in Q2 as the number of rental households fell while the number of home owing households rose.
The history of the number of occupied housing units and the share of renter households since 2012 is shown in the next chart, below. The chart shows that the portion of renters has fallen steadily since peaking in 2015.
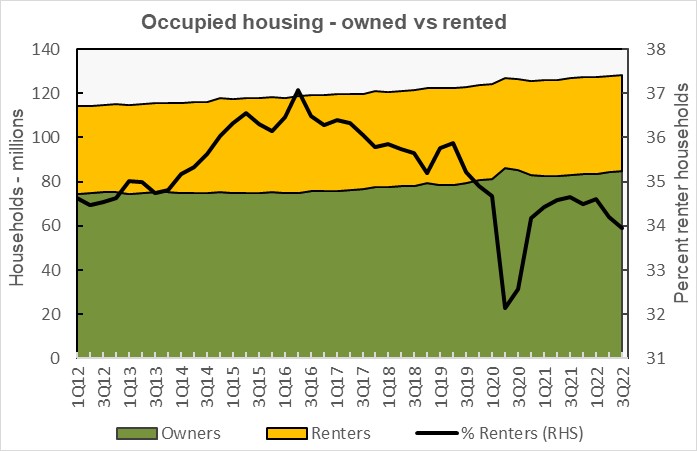
Note that the dip in the rentership rate in 2020 may be due to difficulties that Census had in collecting its data during the pandemic lockdowns. It seems unlikely that the number of homeowning households actually jumped by 4.7 million in Q2 2020 and then dropped by 2.6 million in Q4 2020.
Other than the first year of the pandemic, the number of renter-occupied housing units reported by the Census Bureau since 2016 has consistently been between 43.1 million and 44.2 million. In Q3 2022, the number of renter households was reported to fall to 43.6 million in Q3 from 43.8 million in Q2 and from 44.0 million in Q3 2021. By contrast, the number of owner-occupied housing units rose to 84.7 million in Q3 from 84.2 million in Q2 and from 83.0 million in Q3 2022.
Looking at rents
The Census Bureau also tracks the median asking rents for the country as-a-whole. The history of their findings is shown in the next chart, below. Census reported that rents have moved higher after declining at the end of last year, with the national average rent coming in at $1,334 in Q3 2022, up $20 from the quarter before.
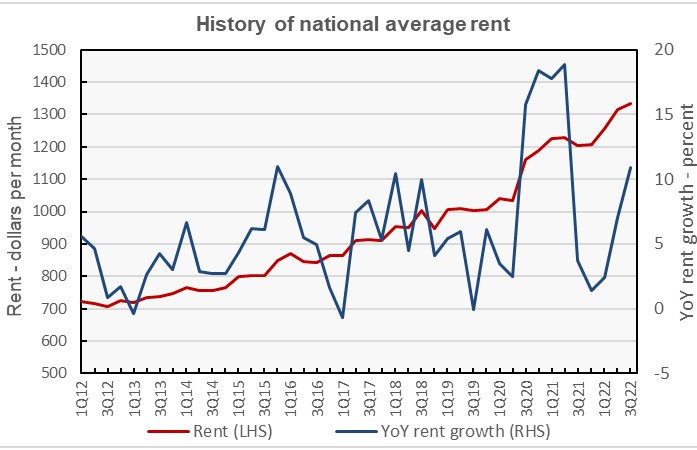
The Census results show key differences with other reports on rental housing. For example, Census data show a quarter-over-quarter drop in rents in Q3 2021. This was a time when other data suppliers, like Apartment List, were reporting record high rates of rent growth. More recently, Census data show low rates of year-over-year rent growth in late 2021 followed by increasing rates of year-over-year rent growth in 2022. Apartment List data shows the opposite. However, the Census Bureau data is sampled from all rental housing, not just large operators of multifamily communities. The Census result here may be consistent with other results they have issued, such as the Pulse survey indicating that over 40 percent of renters have seen their rents either stay the same or fall over the past 12 months.
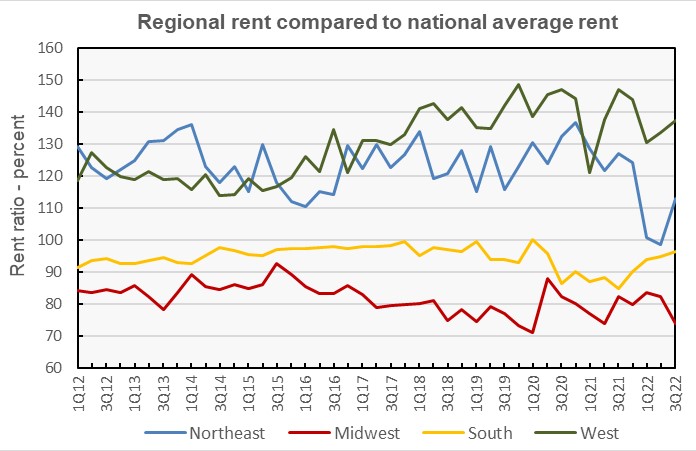
The last chart, below, shows the history of the average rent by Census region as a percentage of the national average rent. It shows rents in the Northeast rebounding in Q3 relative to the national average rents after lagging for the prior two quarters. Midwest rents fell relative to the national average rent while rents in both the South and West recovered to approach their recent long-term levels relative to the national average rent.
The Census report is called Quarterly Residential Vacancies and Homeownership, Third Quarter 2022. It is available here.


