

The latest commercial property price report from MSCI Real Capital Analytics said that multifamily property prices fell 1.1 percent in November from their level of the month before. This was the largest month-over-month decline of any of the commercial property types tracked in the report. However, multifamily property prices were still up 7.4 percent year-over-year. The year-over-year multifamily property price growth rate is down from that initially posted last month, marking the 9th month in a row of declining year-over-year price growth.
Defining CPPI
MSCI tracks an index called the Commercial Property Price Index (CPPI). The index is computed based on the resale prices of properties whose earlier sales prices and sales dates are known. The index represents the relative change in the price of property over time rather than its absolute price. Note that, as properties are added to the MSCI dataset each month, they recalculate the CPPI all the way back to the beginning of the data series.
Industrial is bright spot
Price appreciation in November for all commercial property as a single asset class was 4.9 percent year-over-year. Prices for all commercial property as a single asset class fell by 0.4 percent from the level of the previous month.
Appreciation in industrial property prices was 0.6 percent for the month and 14.4 percent over the past 12 months. Both of these rates are down from those posted last month but they are still the highest of any commercial property category covered in the report.
The poorest performing CPPI for a property type on a year-over-year basis was that for offices within central business districts (CBD). This index was down 0.1 percent for the month and up only 1.8 percent for the year. The CPPI for retail properties was up 0.1 percent for the month and up 7.1 percent for the year.
The poorest performing CPPI for a property category on a year-over-year basis was that for commercial property within 6 major metros*. This index was down 0.4 percent for the month and up only 0.7 percent for the year.
Multifamily returns to earth
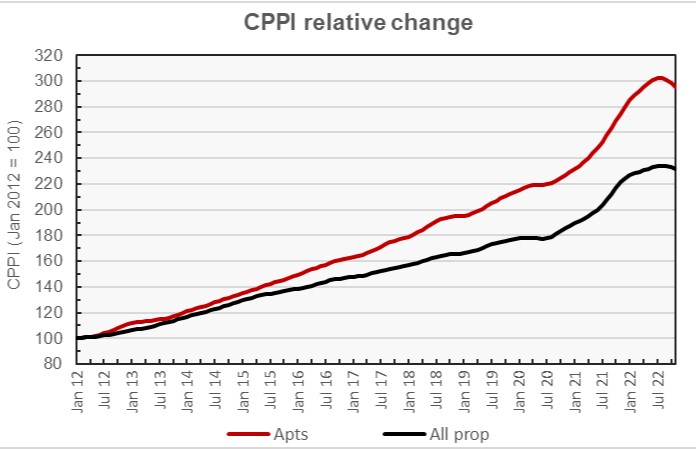
The first chart, below, shows how the CPPI’s for all commercial property and for apartments have changed since January 2012. To simplify the comparison, both CPPI’s have been normalized to a value of 100 in January 2012. The chart shows that the indexes exhibited steady growth from 2012 through 2019 with multifamily property prices appreciating at a higher rate than commercial property prices overall. This was followed by a covid-era surge in prices and by a general decline in prices over the last 5 months.
The next chart plots the year-over-year changes in the values of the CPPI since January 2012 for all commercial property as a single asset class and for apartments. The chart shows how property prices were whipsawed by the pandemic with a huge surge in year-over-year price growth followed by a more recent plunge.
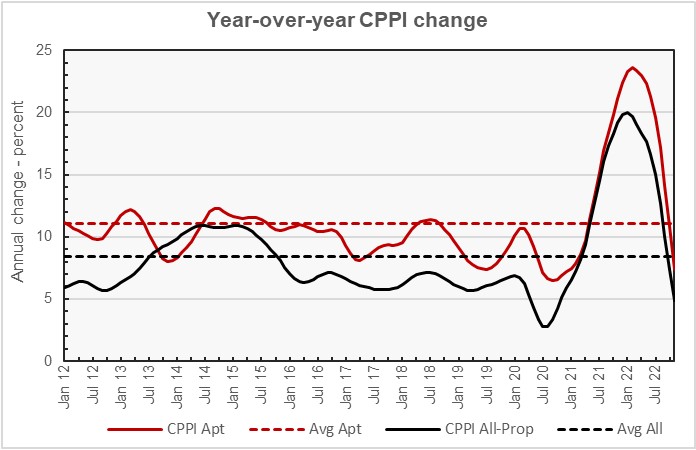
The chart also shows the average rates of annual appreciation in the indexes for the two property classes. The average annual multifamily property price appreciation since January 2012 is 11.1 percent, while the average annual appreciation rate for all commercial property as a single asset class is 8.4 percent. The year-over-year price appreciation for both commercial property categories have now fallen below their long-term averages.
Major metros fall behind
The MSCI report provides data comparing the changes in commercial property prices in 6 major metro areas against those in the rest of the country. However, it does not separate out apartments from other commercial property types in this comparison.
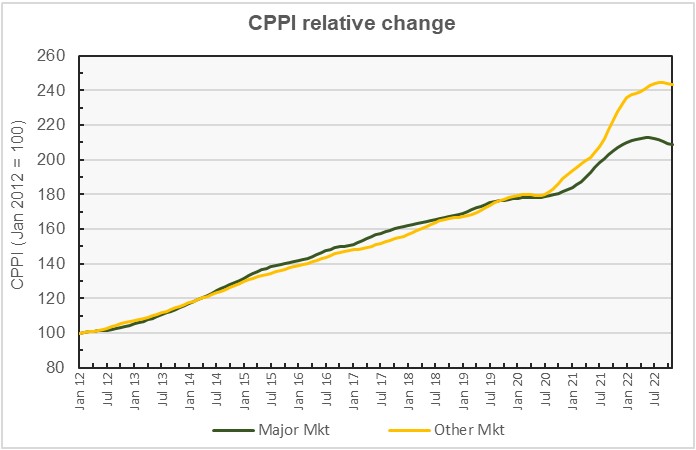
The next chart, below, plots the history of the price indexes since January 2012 for both market segments. It shows that the growth in the two price indexes was very similar until 2021 when commercial property price appreciation in the non-major markets became significantly higher than that in major markets. Currently, cumulative price appreciation in non-major markets since January 2012 is 16.6 percent higher than that in major markets.
The final chart plots the history of the year-over-year change in the price indexes for the two property market segments since January 2012 along with the average rates of price appreciation for the two market segments for the period between January 2012 and December 2019. The latter two lines are nearly coincident showing how similar were the average rates of price appreciation in these two segments during that period.
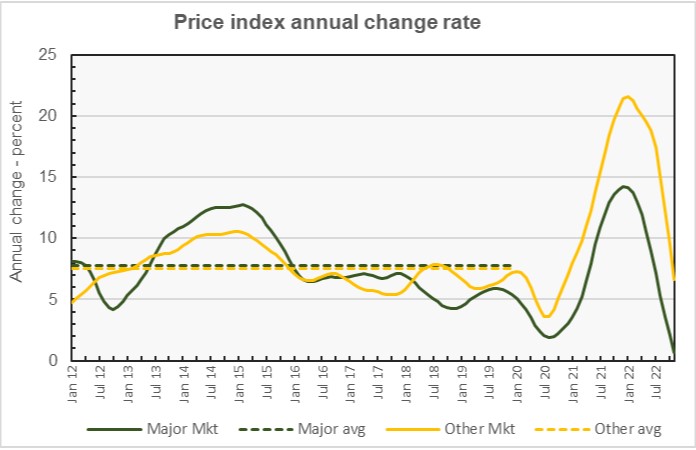
The chart shows how the rates of year-over-year price appreciation diverged during the pandemic. It also shows that, after growing at well above their long-term average rates from mid-2021 to mid-2022, the rates of price appreciation have recently fallen for both market segments. The rates of year-over-year price appreciation for both segments are now below their 2012 to 2019 averages.
By the numbers, price appreciation for commercial property in major markets was reported to be -0.4 percent for the month and 0.7 percent for the year. Price appreciation for commercial property in non-major markets was reported to be -0.3 month-over-month and up 6.7 percent year-over-year. The average rates of price appreciation from 2012 through 2019 are 7.8 percent for major markets and 7.5 percent for non-major markets.
The full report provides more detail on other commercial property types. Access to the MSCI report can be obtained here.
*The major metros are Boston, Chicago, Los Angeles, New York, San Francisco and Washington DC.


