

Yardi Matrix reported that national average apartment rent growth turned negative in November with rents falling $9 from October’s revised level to $1,719 per month.
YoY rent growth rate slide continues
The national average asking apartment rent was up 7.0 percent in November from its year-earlier level. This rate of increase was down 1.2 percentage points from that reported last month. This was the ninth month in succession with a flat or declining rate of year-over-year rent growth and the second month in a row where the decline was 1.2 percent percentage points.
Year-over-year rent growth for leases that were renewed was 11.1 percent in October. The national average lease renewal rate was 63.8 percent.
Rents in the “lifestyle” asset class, usually Class A properties, rose 5.7 percent year-over-year, while rents in “renter by necessity” (RBN) properties increased by 8.6 percent year-over-year. The chart, below, shows the history of the year-over-year rent growth rates for these two asset classes along with the difference between these rates.
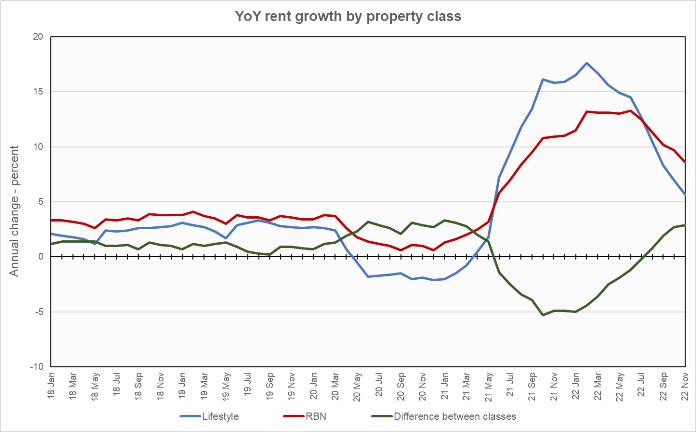
The chart shows that the difference between the year-over-year rent growth rates for the two classes of property has returned to a level closer to that which existed in the first year of the pandemic rather than that which prevailed in the years before. The difference in rent growth rates in the period from May 2021 to March 2022 was 2.8 percent on average. The difference in October was 2.9 percent. For reference, the average difference in rent growth rates in 2018 through 2019 was 1.0 percent.
The chart also shows that the year-over-year rent growth rates for the two classes of property are declining from their pandemic highs. However, they are still well above their pre-pandemic levels. Given that the years before the pandemic were a period of low inflation while the current economic environment features a much higher rate of inflation, it may be unrealistic to expect rent growth rates to return to their pre-pandemic levels until the inflation rate also returns to its pre-pandemic level.
Yardi Matrix also reported that single-family rental (SFR) rents fell $5 from the revised (+$8 per month) level of the month before to $2,091 per month. The year-over-year rent growth rate fell to 5.9 percent. The national occupancy rate for single-family rentals slipped slightly to 95.9 percent in October. Occupancy was down 1.4 percentage points from its level one year ago.
More than rent growth
Yardi Matrix now reports on other key rental market metrics in addition to rent growth. These include the average rent to income ratio, the rent growth rate for residents who renew their leases and the portion of residents who do renew. The metro averages are included in the tables below, but the report also includes the rent to income ratios for both lifestyle and for RBN properties.
Of the top 30 metros by population, the ones with the largest annual apartment rent increases as ranked by Yardi Matrix are given in the table, below, along with their annual percentage rent changes, overall rent to income ratio, rent growth for renewed leases and renewal rate for the month. The data on asking rent growth is for November. The other data is for October.
| Metro | YoY asking rent growth % | Rent to income ratio % | YoY renewal rent growth % | Monthly lease renewal rate % |
| Indianapolis | 11.4 | 26.2 | 9.7 | 64.7 |
| Miami Metro | 9.7 | 31.1 | 20.5 | 66.5 |
| San Jose | 9.6 | 28.4 | 5.7 | 49.3 |
| Kansas City | 9.2 | 24.6 | 10.5 | 69.7 |
| Orlando | 9.2 | 32.8 | 16.2 | 65.6 |
| Nashville | 8.7 | 29.5 | 14.3 | 57.3 |
| Dallas | 8.6 | 22.0 | 13.9 | 61.6 |
| Raleigh | 8.4 | 27.8 | 18.0 | 65.9 |
| Charlotte | 8.1 | 25.7 | 15.3 | 59.8 |
| New York | 7.5 | 31.5 | 10.4 | 69.3 |
The major metros with the smallest year-over-year apartment rent growth as determined by Yardi Matrix are listed in the next table, below, along with the other data as in the table above.
| Metro | YoY asking rent growth % | Rent to income ratio % | YoY renewal rent growth % | Monthly lease renewal rate % |
| Las Vegas | 2.0 | 30.8 | 15.0 | 64.6 |
| Phoenix | 2.5 | 28.8 | 15.1 | 62.8 |
| Twin Cities | 2.9 | 28.2 | 7.0 | 60.5 |
| Baltimore | 3.7 | 25.1 | 9.7 | 70.3 |
| Sacramento | 3.9 | 28.1 | 10.2 | 59.3 |
| San Francisco | 4.4 | 25.9 | 3.7 | 47.3 |
| Atlanta | 4.5 | 12.1 | 64.4 | |
| Houston | 4.8 | 26.5 | 6.7 | 62.7 |
| Washington DC | 5.0 | 28.4 | 7.5 | 58.2 |
| Austin | 5.2 | 29.0 | 15.2 | 58.9 |
The top metros for month-over month rent growth in November were New York, Indianapolis and Kansas City, the same metros as last month. The metros with the lowest month-over-month rent growth were Boston, Las Vegas and San Jose. Of the 30 major metros tracked by Yardi Matrix, all but two, Miami and New York, saw negative month-over-month rent growth in November.
A look at the GSE’s
The government-sponsored enterprises, Fannie Mae and Freddie Mac, are very important to multifamily finance and they are the focus of the discussion section in this month’s report. The report notes that rising interest rates have suppressed demand for multifamily finance. It anticipates that the GSE’s are unlikely to reach their allocation levels for multifamily mortgage originations in 2022. It also notes that their allocations for 2023 have been reduced. However, it suggests that the GSE’s may be content with a reduced level of business at this time given the uncertainties in the market.
SFR metrics fall
Yardi Matrix also reported on the top 34 metros for single family rentals. This month, 30 of the 34 metros covered saw positive year-over-year rent growth, with Atlanta, San Francisco, Detroit and Nashville being the exceptions. The leading metros for year-over-year rent growth were Sacramento, Washington D.C. and Indianapolis.
Also this month, 28 of the metros saw year-over-year declines in occupancy. The leading metros for year-over-year SFR occupancy growth were Raleigh, Philadelphia and Orange County. Las Vegas, Seattle and Tampa saw the greatest SFR occupancy declines.
The complete Yardi Matrix report provides information on some of the smaller multifamily housing markets. It also has more information about the larger multifamily markets including numbers on job growth and completions of new units. It includes charts showing the history of rent changes in 18 of the top 30 markets over the last 4 years. It can be found here.


