

The Census Bureau’s new residential construction report for December reported that the number of multifamily permits issued increased but that starts and completions both fell for the month. Starts exceeded completions again leading the number of multifamily units under construction to rise to another new high.
The report on single-family housing construction was mixed. On a seasonally adjusted basis, single family permits fell 7 percent and completions fell 8 percent, but starts rose 11 percent month-over-month. The number of single-family units under construction rose 2,000 to 769,000 units.
Multifamily housing permits rebound
The number of permits issued for buildings with 5 or more units in December was reported to be 555,000 units on a seasonally adjusted, annualized basis. This was up 7 percent (37,000 units) from November’s revised (+9,000 units) figure. December permits were down 22 percent from the level recorded in December 2021 and were down 12 percent from the trailing 12-month average.
In addition, 45,000 permits were issued in December for units in buildings with 2 to 4 units. This was down 7,000 units from the level for November. December permits for units in buildings with 2 to 4 units were down 34 percent from the year-ago level and were down 17 percent from the trailing 12-month average.
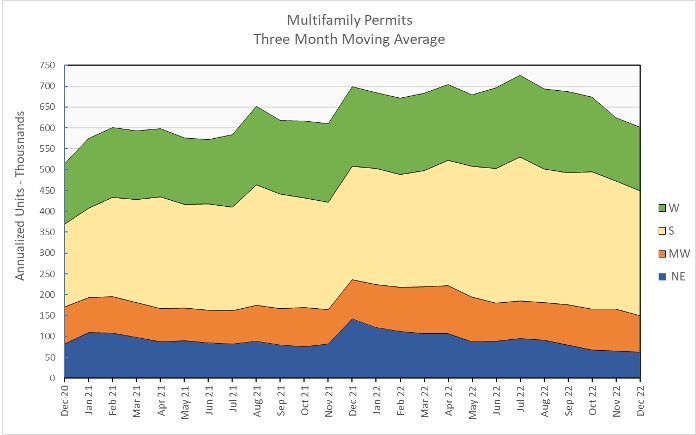
Regional data for multifamily housing is only reported for structures with two or more units. “Structures with 5 or more units” is not broken out as a separate category. Since the regional data is highly volatile and is frequently revised, it is examined here based on three-month moving averages. This averaging will tend to smooth out the month-to-month variations in the data.
Nationally, the three-month weighted moving average for permits issued for multifamily housing in December was down 4 percent from the level in November and was down 14 percent from the level of December 2021. The three-month weighted moving average for permits came it at 602,000 units.
On a month over month basis, the three-month weighted moving average for multifamily permit issuance was up 1 percent in the West but was down 3 percent in the South, 6 percent in the Northeast and 12 percent in the Midwest.
When compared to year-earlier levels, the three-month weighted moving average of permits issued was up 10 percent in the South but was down 7 percent in the Midwest, 20 percent in the West and 56 percent in the Northeast.
The following chart shows the three-month weighted moving averages of permits by region for the last 25 months.
Multifamily housing construction starts plunge
The preliminary December figure for multifamily housing starts in buildings with 5 or more units was 463,000 units on a seasonally adjusted, annualized basis. This was reported to be down 19 percent (108,000 units) from the revised figure (-13,000 units) for November.
Compared to the level of December 2021, multifamily housing starts in buildings with 5 or more units were down 16 percent. The reported starts figure was 14 percent lower than the trailing 12-month average but was 19 percent higher than the monthly average from 2019.
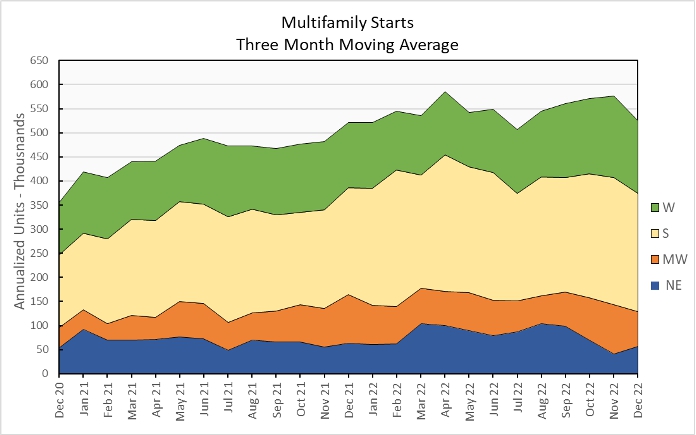
Multifamily housing construction starts (two or more units per building) in December were down 9 percent from their November level for the country as-a-whole, based on three-month weighted moving averages. Starts were up 40 percent in the Northeast but down 7 percent in the South, 11 percent in the West and 30 percent in the Midwest from the levels of the prior month.
The three-month weighted moving average of starts was up 1 percent for the country-as-a-whole on a year-over-year basis. Compared to December 2021, starts were up 12 percent in the West and 11 percent in the South. However, starts were down 25 percent in the Northeast and 29 percent in the Midwest.
The following chart shows the three-month weighted moving average of starts by region for the last 25 months.
Multifamily housing completions fall
The preliminary December multifamily housing unit completions figure in buildings with 5 or more units per building was 385,000 units on a seasonally adjusted, annualized basis. This was reported to be down 12 percent (53,000 units) from November’s revised (+8,000 units) figure.
Compared to December 2021, multifamily housing completions in buildings with 5 or more units per building were up 26 percent. Compared to the trailing 12-month average, completions were up 10 percent and compared to the monthly average for 2019, completions were up 11 percent.
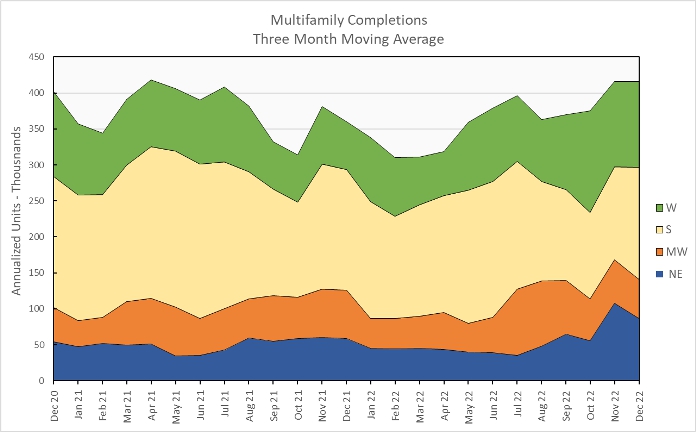
For the country as-a-whole, multifamily housing construction completions (two or more units per building) were unchanged month-over-month, comparing three-month weighted moving averages. The three-month weighted moving averages of completions was up 21 percent in the South and less than 1 percent in the West. However, completions were down 10 percent in the Midwest and 20 percent in the Northeast.
On a year-over-year basis, the three-month weighted moving average of completions in buildings with 2 or more units per building was up 16 percent nationally. Completions were up 79 percent in the West and 49 percent in the Northeast. Completions fell 7 percent in the South and 20 percent in the Midwest.
The three-month weighted moving average of completions by region for the past 25 months are shown in the chart below.
The number of multifamily units under construction was up again in December. The number of units under construction has been flat or higher every month since December 2020. Census reported that there were 926,000 units under construction in buildings with 5 or more units per building on a seasonally adjusted basis. This is up by 9,000 units from the revised (+2,000 units) level of the month before. It is 25 percent, or 184,000 units, higher than the number of units under construction one year earlier.
The high for multifamily units under construction reached during the boom of the 1970’s was 901,000 units in 1973.
All data quoted are based on seasonally adjusted results and are subject to revision.


