

A report from the Mortgage Bankers’ Association (MBA) says that originations of multifamily mortgages in Q4 were down 52 percent on a year-over-year basis. Originations of all commercial mortgages as a single asset class fell 54 percent.
Multifamily mortgage originations break the pattern
The first chart, below, shows the MBA’s quarterly origination volume indexes since Q1 2018 for both all commercial mortgages as a single asset class and for multifamily mortgages. The indexes are reported relative to the year 2001, with the average quarterly volume in that year defined as a value of 100.
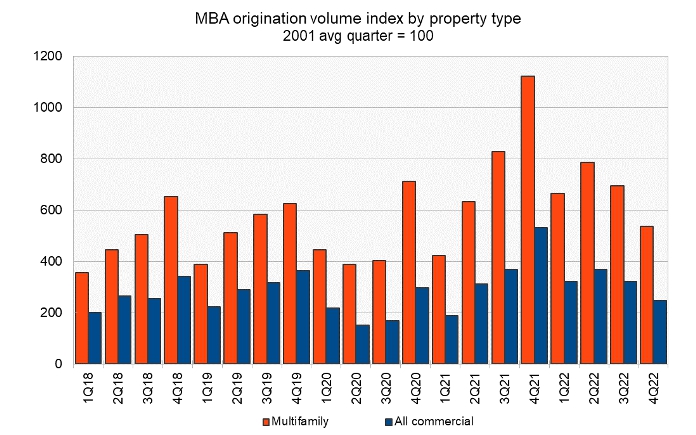
The mortgage origination volume data generally exhibit a strong seasonal pattern of progressively higher originations quarter to quarter through the year. The pandemic year of 2020 was an exception to this pattern, as is now the year 2022. While the first two quarters of 2022 started off as if the year was going to follow the typical pattern, the last two quarters of the year atypically experienced falling originations volumes. In fact, the origination volume in Q4 was lower than that in Q1, something that did not even happen in 2020.
All six property categories mentioned in the report (multifamily, office, retail, industrial, hotel and health care), atypically saw lower mortgage origination volume in Q4 2022 than in Q1. Only the office category saw higher originations in Q4 than in Q3 and that by only 9 percent.
Who’s lending?
The MBA report also includes data on the sources of the commercial mortgages being originated. However, this section of the report does not break out multifamily lending from lending on other types of commercial real estate.
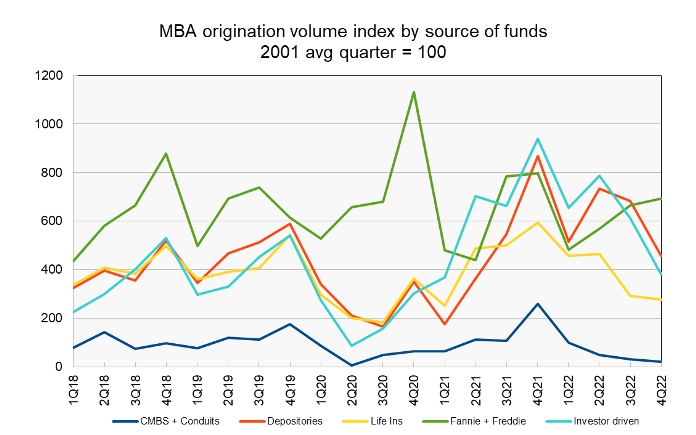
The report provides data on five categories of lenders: commercial mortgage-backed securities (CMBS) and conduits, depositories (aka commercial banks), life insurance companies, the government sponsored entities (GSEs), Fannie Mae and Freddie Mac, and investor-driven lenders such as REITs and specialty finance companies. The index values are quoted relative to the average quarterly origination volumes in the year 2001. The index values of different originators cannot be used to compare their absolute levels of mortgage originations since their origination levels in the baseline year of 2001 were different.
To gain insight into the absolute levels of funding provided by the different classes of originators, readers should look to the MBA’s report on mortgage debt outstanding. However, the origination index values can be compared to see which classes of originators are growing their business and which are not.
Of the five categories of lenders, only the GSEs increased their commercial mortgage originations quarter-over-quarter in Q4, with a 4 percent rise. The GSEs were also the only one of the five categories of lenders who increased their commercial mortgage originations from their level in Q1.
On a year-over-year basis, all five categories of lenders saw their commercial mortgage originations fall. Issuance fell 92 percent for CMBS, 60 percent for investor-drive lenders, 53 percent for life insurers, 47 percent for depositaries and 13 percent for the GSEs.
The final chart shows the history of commercial mortgage origination volume indexes since Q1 2018 by class of lender. It shows that the GSEs stepped in to provide mortgages when other lenders reduced their originations in 2020. The GSEs appear to have also stepped in in Q4 2022 as originations by other lenders fell.
The full report from the MBA includes additional information on lending for other commercial property types. It can be found here.


