

CoStar reported that its value-weighted index of multifamily property prices fell 3.7 percent year-over-year in January 2023. This index was down 1.3 percent month-over-month, the seventh monthly decline in a row.
The value-weighted index of non-multifamily commercial property fell by 2.1 percent, year-over-year, in January. This index rose 0.9 percent month-over-month. The other commercial property types tracked by CoStar are office, retail, industrial and hospitality.
For more information on the CoStar Commercial Repeat Sales Indexes (CCRSI’s), please see the section at the bottom of this report.
Comparing property types
The first chart, below, shows the history of the value-weighted CCRSI’s since January 2012 for multifamily property and for all other commercial property considered as a single asset class. It also shows trend lines for the growth in the two CCRSI’s based on their growth in the period from January 2012 to January 2020. The indexes are normalized so that their values in December 2000 are set to 100.
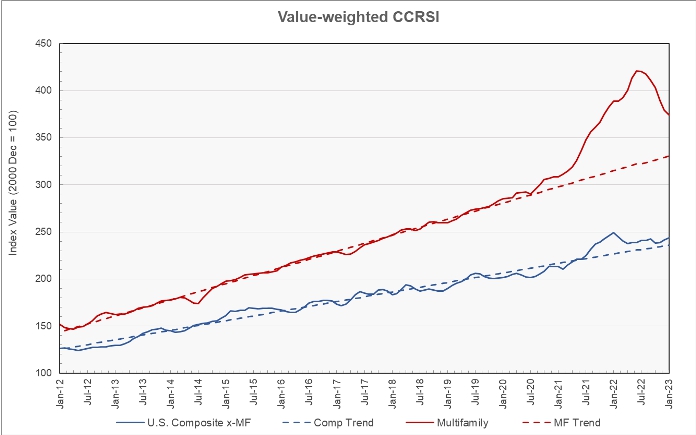
The chart shows that the two indexes deviated significantly from the trend line over the last two years. The multifamily price index was as much as 31 percent above trend in June 2022. The price index for non-multifamily commercial property was 10 percent above trend in January 2022. The current multifamily property price index is still 13 percent above trend, but this gap has narrowed over the past 7 months. The price index for other commercial property is now 3 percent above trend and has widened marginally in recent months.
The second chart shows the year-over-year change in the value-weighted multifamily property price index and that for all other commercial property types since January 2012. It also shows the average rates of annual price growth for the two property classes over that time.
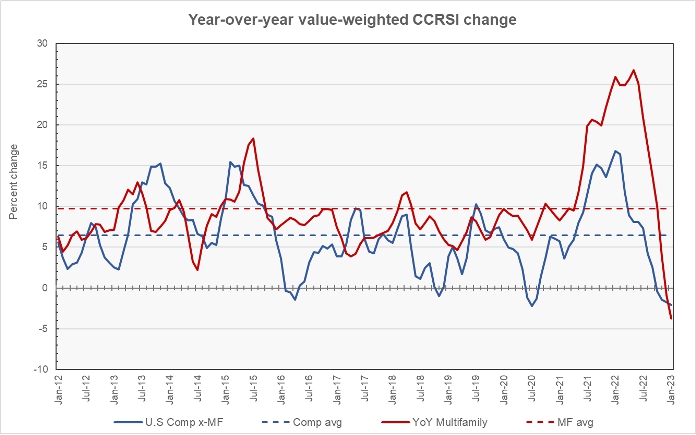
The chart shows that the year-over-year rate of increase in the multifamily property price index is now well below that of any other month shown. However, this performance is still much better than that in 2009 when year-over-year price declines of up to 24 percent were seen.
The rate of year-over-year increase in other commercial property prices has been in increasingly negative territory for the last 4 months.
The annual increase in multifamily property prices has been 9.7 percent while that of other commercial property prices has been 6.5 percent.
Transaction volumes collapse
An issue with monthly transaction volume reporting is that CoStar usually identifies additional transactions to tabulate over the next few months after the initial report, and these transactions can have a large influence on the results. For example, the latest report identified an additional 169 transactions for December not reported last month.
Even considering that more transactions for January may be discovered next month, the decline in activity from December’s level was significant. Transaction count was down 31 percent from the preliminary count reported last month and was down 38 percent from the revised count for December included in this report.
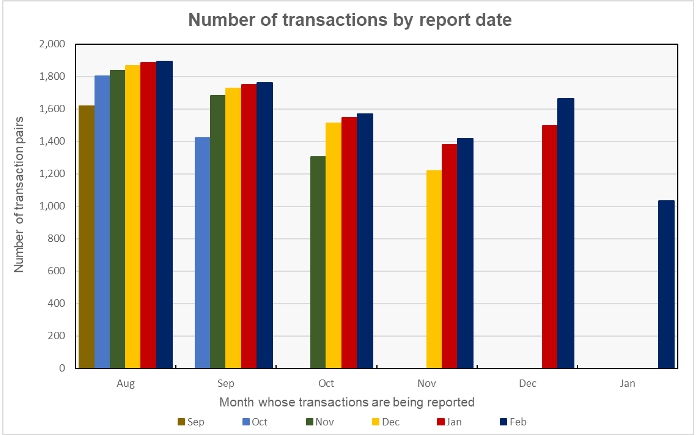
The next chart shows how the reported transaction count has varied between reports. Each cluster of bars represents a month whose transaction count is being reported. Each bar in the cluster indicates the month of the CCRSI report which contained that count value. For example, the August transaction count has been listed in the six CCRSI reports released since September, while the January count has only been listed in the February CCRSI report. The chart illustrates that, while the first revision to a reported transaction count may be significant, the size of the revisions to each month’s transaction count generally declines over time.
The preliminary dollar volume of transactions was also reported to fall significantly in January. Transaction dollar value was down 44 percent from the preliminary value reported last month and was down 51 precent from the revised transaction value for December reported this month. The preliminary dollar transaction value for January came in at $6.26 billion, the lowest amount since August 2020.
The full report discusses all commercial property types. While the CoStar report provides information on transaction volumes, it does not break out multifamily transactions. The latest CoStar report can be found here.
CCRSI defined discrepancy
The CoStar report focuses on a relative measure of property prices called the CoStar Commercial Repeat Sales Index (CCRSI). The index is computed based on the resale of properties whose earlier sales prices and sales dates are known. The index represents the relative change in the price of property over time rather than its absolute price. CoStar identified 1,032 repeat sale pairs in January for all property types. These sales pairs were used to calculate the results quoted here.
CoStar computes CCRSI’s for a variety of property groupings, combining them by cost, region, property type or other factors. The value-weighted index is more heavily influenced by transactions of expensive properties than is CoStar’s equal-weighted index. The value-weighted index is the focus of this report because it is an index whose value is reported monthly and for which CoStar breaks out multifamily property as a separate category.


