

A report from the Mortgage Bankers’ Association (MBA) says that multifamily mortgage originations in Q1 2023 were down 55 percent on a year-over-year basis. Commercial mortgage originations overall fell 56 percent.
Commercial mortgage originations down across the board
The first chart, below, shows the MBA’s quarterly origination volume indexes since Q1 2018 for both all commercial mortgages as a single asset class and for multifamily mortgages. The indexes are reported relative to the year 2001, with the average quarterly volume in that year defined as a value of 100.
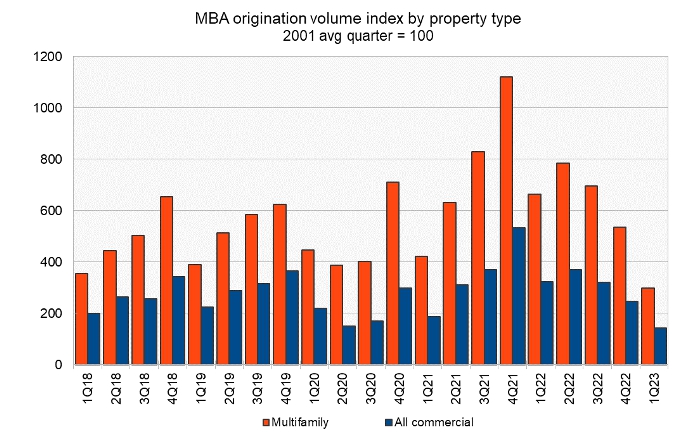
The mortgage origination volume data generally exhibit a strong seasonal pattern where Q1 volume is down from that of Q4 of the year before but then volume builds through each successive quarter of the year. This is apparent in the data in the chart from the years 2018, 2019 and 2021. However, while 2022 started out with Q2 volume rising from that in Q1, the last two quarters of the year saw mortgage origination volumes fall. This new pattern of declining mortgage origination volume continued in Q1 2023 with volume dropping from that in Q4 2022 and also dropping from that of Q1 2022.
All six property categories mentioned in the report (multifamily, office, retail, industrial, hotel and health care), saw mortgage origination volume decline in Q1 2023. Hotel and Retail saw volumes decline by only 8 percent year-over-year while the other categories of properties saw mortgage origination volumes decline by more than 50 percent.
Tracking who’s lending
The MBA report also includes data on the sources of the commercial mortgages being originated. However, this section of the report does not break out multifamily lending from lending on other types of commercial real estate.
The report provides data on five categories of lenders: commercial mortgage-backed securities (CMBS) and conduits, depositories (aka commercial banks and savings and loans), life insurance companies, the government sponsored entities (GSEs), Fannie Mae and Freddie Mac, and investor-driven lenders such as REITs and specialty finance companies.
The index values are quoted relative to the average quarterly origination volumes in the year 2001. The index values of different originators cannot be used to compare their absolute levels of mortgage originations since their origination levels in the baseline year of 2001 were different. To gain insight into the absolute levels of funding provided by the different classes of originators, readers should look to the MBA’s report on mortgage debt outstanding. However, the origination index values can be compared to see which classes of originators are growing their business and which are not.
The final chart shows the history of commercial mortgage origination volume indexes since Q1 2018 by class of lender. It shows that commercial mortgage originations are down significantly from their pre-pandemic averages.
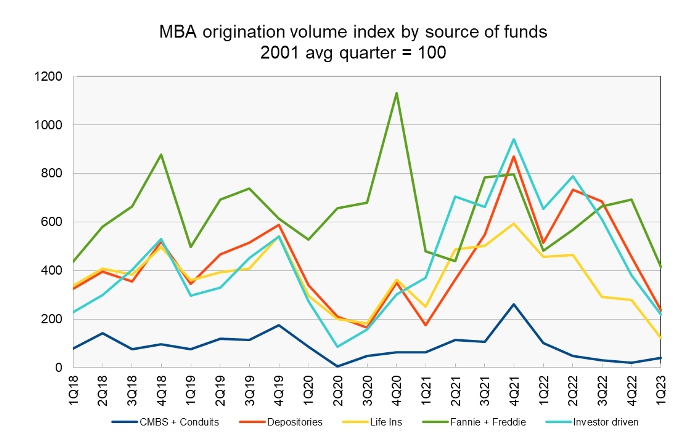
Of the five categories of lenders, only CMBS and conduits increased their commercial mortgage originations quarter-over-quarter in Q1. While the quarter-over-quarter rise in originations was large at 95 percent, this is partly because CMBS and conduit originations in Q4 2022 were very depressed. Q4 originations for CMBS and conduits were down 92 percent from their year-earlier level and were only 19 percent of their average quarterly level for 2018 and 2019.
On a year-over-year basis, all five categories of lenders saw their commercial mortgage originations fall. Issuance fell 59 percent for CMBS, and conduits, 54 percent for depositaries, 73 percent for life insurers, 14 percent for the GSEs and 67 percent for investor-drive lenders.
The full report from the MBA includes additional information on lending for other commercial property types. It can be found here.


