

CoStar reported that its value-weighted index of multifamily property prices fell 7.2 percent year-over-year in March 2023. However, this index was up 1.4 percent month-over-month, the first monthly rise after a string of 8 months where prices fell.
The value-weighted index of non-multifamily commercial property rose by 1.8 percent, year-over-year, in March. This index fell 1.4 percent month-over-month. The other commercial property types tracked by CoStar are office, retail, industrial and hospitality.
For more information on the CoStar Commercial Repeat Sales Indexes (CCRSI’s), please see the section at the bottom of this report.
Multifamily lags year-over-year
The first chart, below, shows the history of the value-weighted CCRSI’s since January 2012 for multifamily property and for all other commercial property considered as a single asset class. It also shows trend lines for the growth in the two CCRSI’s based on their growth in the period from January 2012 to January 2020. The indexes are normalized so that their values in December 2000 are set to 100.
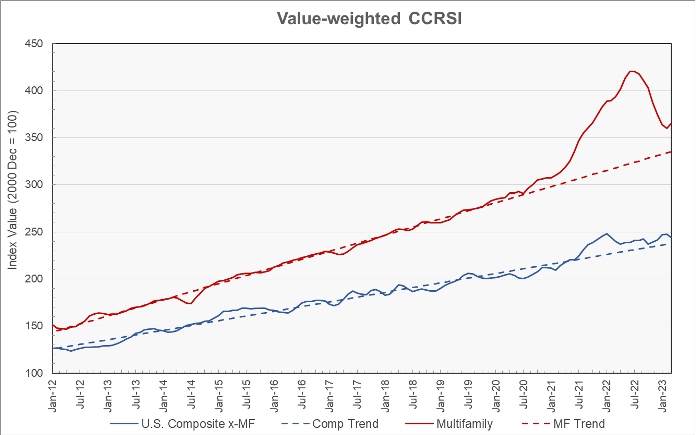
The chart shows that the two indexes have been moving in the direction of their long-term trend lines recently after significantly deviating from them over the last 3 years. However, while the CCRSI for non-multifamily property moved closer to the trend line in March, the index of multifamily property prices moved farther away from the trend line. The latter index is now nearly 9 percent above the level of the long-term trend.
The second chart shows the year-over-year change in the value-weighted multifamily property price index and that for all other commercial property types since January 2012. It also shows the average rates of annual price growth for the two property classes over that time.
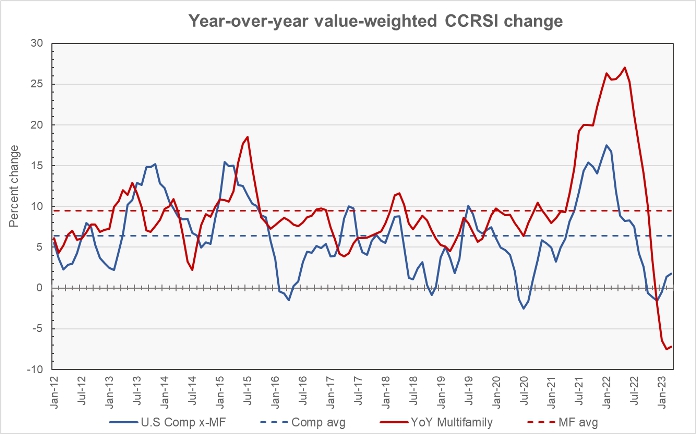
The chart shows that the year-over-year growths in property prices have fallen sharply from their recent highs. Multifamily property prices have now experienced a string of 4 months where growth has been negative. However, non-multifamily commercial property now has had two months in a row of positive year-over-year price growth after 4 months in a row of negative growth.
The average annual increase in multifamily property prices over the period represented by the chart has been 9.5 percent while that of other commercial property prices has been 6.4 percent.
Tracking the regions
CoStar’s quarterly reports include information on changes in the equal-weighted CCRSI by property type by region. The history since Q4 2000 of these regional indexes for multifamily property is shown in the next chart, below.
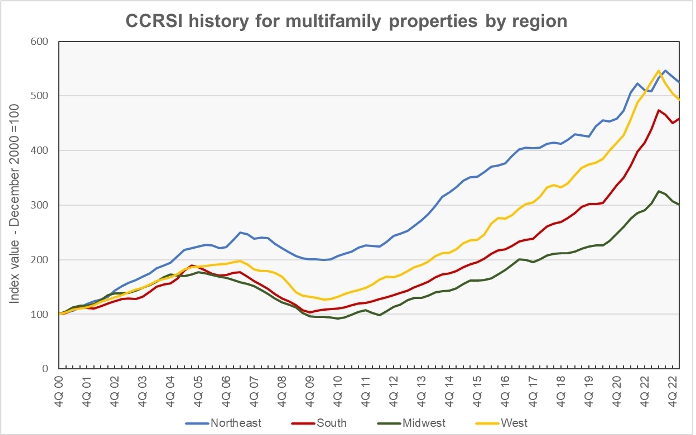
While prices in the Northeast region have risen more than in the other regions since 2000, they have risen at the slowest pace of any of the regions since 2012. Since 2012, the average year-over-year increase in the regional multifamily CCRSI for the Northeast region has been 6.2 percent. The South region has had the highest average rate of price appreciation at 13.9 percent, followed by the West at 12.0 percent and the Midwest at 10.6 percent.
The next chart shows the history of the regional year-over-year changes in multifamily property prices by quarter since 2016. The chart shows the rate of year-over-year price increases falling sharply in all regions of the country over the last year. Year-over-year price changes were negative in two regions of the country in Q1 and were below their long-term trend rate in another.
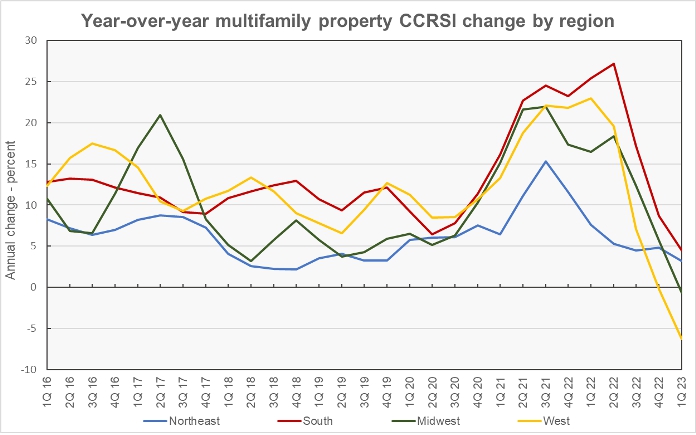
Based on CoStar’s equal-weighted quarterly indexes and comparing to year-earlier levels, prices in Q1 2023 were up by 4.5 percent in the South and 3.2 percent in the Northeast. Prices fell year-over-year by 0.7 percent in the Midwest and 6.3 percent in the West.
Transaction volumes rise
An issue with monthly transaction volume reporting is that CoStar usually identifies additional transactions to tabulate over the next few months after the initial report, and these extra transactions tend to make initial reports of declining transaction volumes worse.
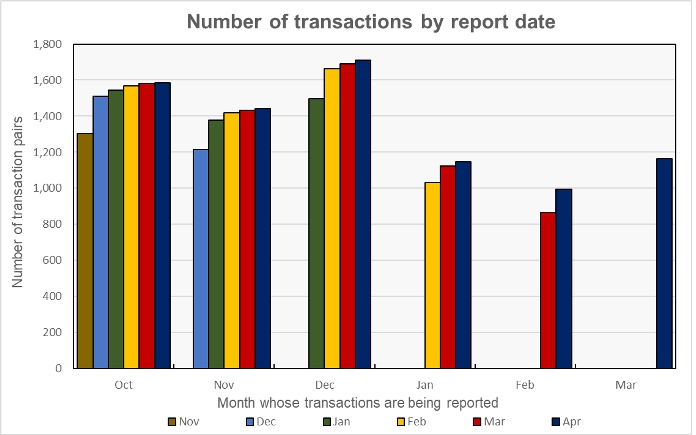
The effect of these revisions is shown in the next chart, below. The cluster of bars at the left side of the chart represent the 6 reports that have been made so far as to the volume of transactions for October 2022. The preliminary volume reported in November 2022 was 1,303 transactions. This count was revised to 1,511 transactions in the December report and to 1,545 transactions in the January report. The current (April) report puts the October transaction count at 1,583. The 21 percent additional October transactions identified between November and April can change the assessment of how October’s transaction volume stacks up against that of any month to which it is being compared. Making comparisons based on early reports will tend to accentuate any decline in volume and to attenuate any volume increase.
Despite this down-side bias in the way the data is reported, CoStar found that transaction volumes increased during March. This was true both based on the count of the number of transactions and also based on the dollar volume of transactions reported.
The preliminary number of transactions reported for March was up 34.7 percent from the preliminary level of the month before. It was up 17.1 percent month-over-month from the revised level of the month before as presented in the April report.
The preliminary dollar volume of transactions was reported to rise 41.3 percent from the revised level of the month before. It was up 54.0 percent from the preliminary level reported last month.
The full report discusses all commercial property types. While the CoStar report provides information on transaction volumes, it does not break out multifamily transactions. The latest CoStar report can be found here.
CCRSI defined
The CoStar report focuses on a relative measure of property prices called the CoStar Commercial Repeat Sales Index (CCRSI). The index is computed based on the resale of properties whose earlier sales prices and sales dates are known. The index represents the relative change in the price of property over time rather than its absolute price. CoStar identified 1,164 repeat sale pairs in March for all property types. These sales pairs were used to calculate the results quoted here.
CoStar computes CCRSI’s for a variety of property groupings, combining them by cost, region, property type or other factors. The value-weighted index is more heavily influenced by transactions of expensive properties than is CoStar’s equal-weighted index. The value-weighted index is the focus of this report because it is an index whose value is reported monthly and for which CoStar breaks out multifamily property prices separately.


