

A whitepaper from NIC MAP Vision looks at how the lease-up rates for senior housing properties have changed over the past 10 years. It finds that the pandemic greatly slowed lease-up rates for new properties but that rates are now slowly approaching per-pandemic levels.
Setting the lease-up rate pattern
For the whitepaper, NIC MAP Vision collected data from 1500 properties over 140 different markets for the period from 2012 to 2022. It assessed how the occupancy of the properties built up after their openings, quarter by quarter. A sampling of the results is shown in the first chart, below.
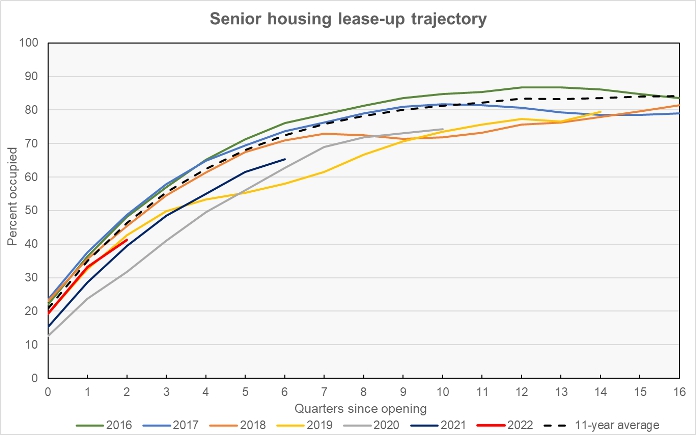
While the survey started with properties that opened in 2012, the earliest year shown in the chart is 2016. This year was selected because the lease-up trajectories for 2012 through 2016 are very similar. The chart also plots the average lease-up data for all 11 years studied.
Properties that opened in the year 2019 started off building their occupancy at a slightly lower rate than did properties that opened in earlier years. This is seen in the 2019 curve for quarters 0 (preleasing), 1 and 2. While the lag in occupancy growth is visible in the data, the difference was not substantial. Around quarter 3, the effects of the pandemic become visible in the lease-up trajectory with a significant slowdown in the rate at which occupancy built up.
The pandemic-induced slowdown in occupancy growth is also visible in the lease-up trajectory curve for 2018 starting around quarter 7, in the curve for 2017 starting around quarter 11 and in the curve for 2016 starting around quarter 15.
The occupancy growth trajectory for the pandemic year of 2020 was affected along its entire history. On the other hand, the trajectories for 2021 and 2022, while still in their early stages, seem to be moving closer to those of the pre-pandemic years.
Tracking the max
The NIC MAP Vision white paper also contains information about the highest rate of occupancy achieved by the properties over their operating histories. It looked at occupancy levels from 80 percent to 95 percent and noted the percentage of properties opened in a given year that ever achieved those occupancy levels. The results for properties whose maximum occupancy rate over its operating history was less than 80 percent and the properties whose maximum occupancy rates were over 90 percent are shown in the next chart, below.
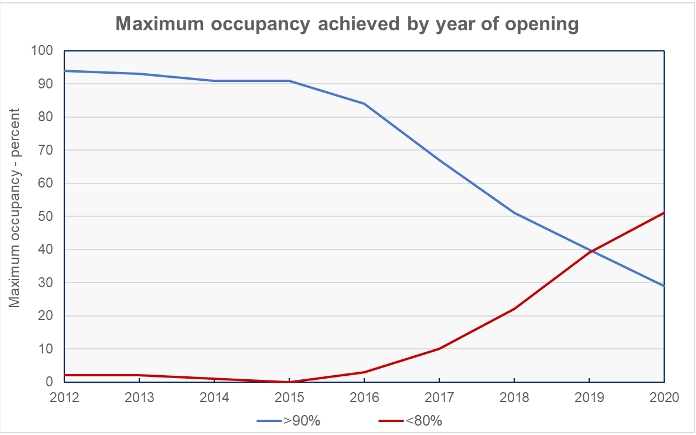
The chart shows that 90 percent or more of the properties which opened in 2015 or earlier achieved 90 percent or higher occupancy at some point. Only a very small percentage of these properties did not reach at least 80 percent occupancy in their operating histories. However, the maximum occupancy rates start to change noticeably beginning with properties which opened in 2016. By the time we get to properties which opened in 2020, some of which have been operating for 3 years, half of the properties have never exceeded 80 percent occupancy and only 29 percent have ever exceeded 90 percent occupancy.
The data show that senior housing properties take years to achieve their maximum occupancy levels. Lease-up rates were negatively affected by the pandemic but now seem to be returning to pre-pandemic patterns.
The full report from NIC MAP Vision contains other insights and is available here.


