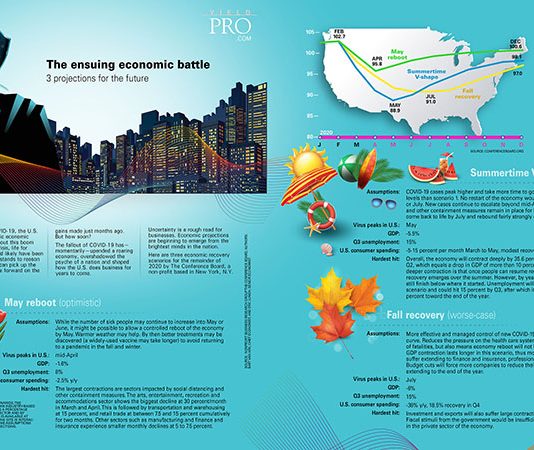
Infographic: Tornado tumult
Tornado tumult Tornado count through May 2019. The total annual average is 743. This 2-year trend follows a lull in tornado activity stretching back to 2012.
Thunderstorms: Earth’s cooling agent - In summer, hot,...
Infographic: Comfort creatures
The curious case of comfort animals in apartments
Why pay a pet deposit when you can pass an animal off as a comfort animal? Or maybe a resident wants to circumvent a no-pet policy. The...
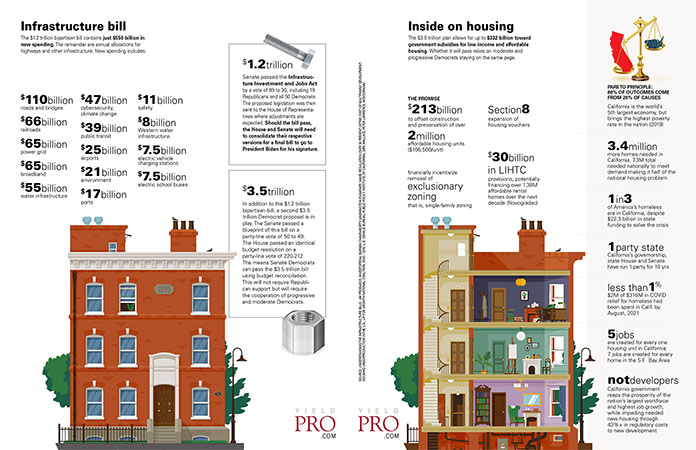
Infographic: Infrastructure bill
The $1.2 trillion bipartisan bill contains just $550 billion in new spending. The remainder are annual allocations for highways and other infrastructure. New spending includes:
$110 billion roads and bridges
$66 billion railroads
$65...
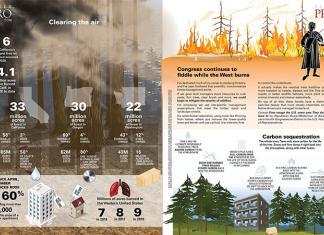
Infographic: Clearing the air
CALIFORNIA
6 of California’s largest fires on record occurred in 2020.
1 million acres have burned in California in 2020 to date
33 million acres of forest in California
58% federally owned
3% state...
Infographic: The Big Chill
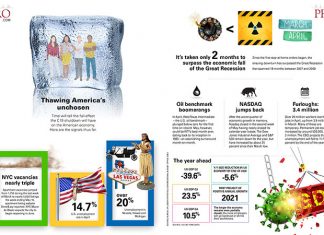
Thawing America’s unchosen
Time will tell the full effect the C19 shutdown will have on the American economy. Here are the signals thus far.
NYC vacancies nearly triple
Apartment vacancies jumped from 1,750 during the last week...
Infographic: Quantum supremacy
The man in the machine
Programmed by humans, algorithms begin with a logic tree specifying every facet of the code’s behavior from content prioritization to blacklisting. With Google’s near monopoly, what hangs in the...
Infographic: Is convenience a fair trade for privacy?
Is convenience a fair trade for privacy?
What level of market share constitutes a monopoly, effectively obstructing free market competition?
Driver’s licenses, passports, mugshots—are searched using facial recognition technology by the FBI. Watchdogs have asked lawmakers...
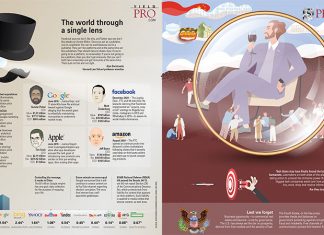
Infographic: The world through a single lens
Facebook says we don’t like this, and Twitter says we don’t like attacks on Hunter Biden. Once you act as a publisher, you’re a publisher. You can be sued because you’re a publisher. They...
Infographic: Unplugged in California
2 million residents were without power for days at a time in the state’s outages
6,402 wildfires in Calif. as of Nov. 3. Wind-induced fire season runs Oct. to April. Summer fire season runs June...
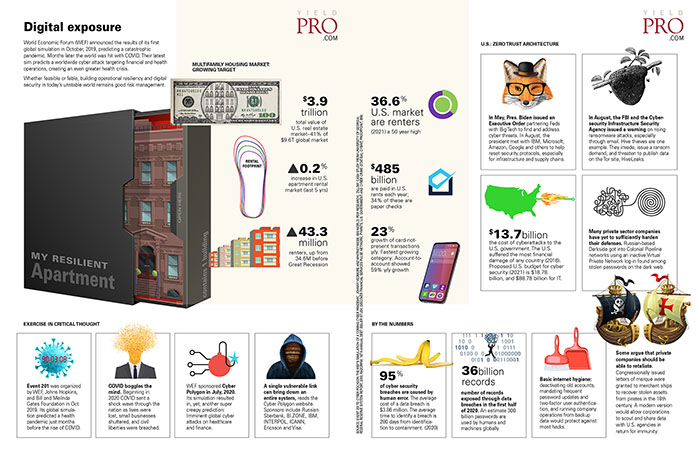
Infographic: Digital exposure
World Economic Forum (WEF) announced the results of its first global simulation in October, 2019, predicting a catastrophic pandemic. Months later the world was hit with COVID. Their latest sim predicts a worldwide cyber...
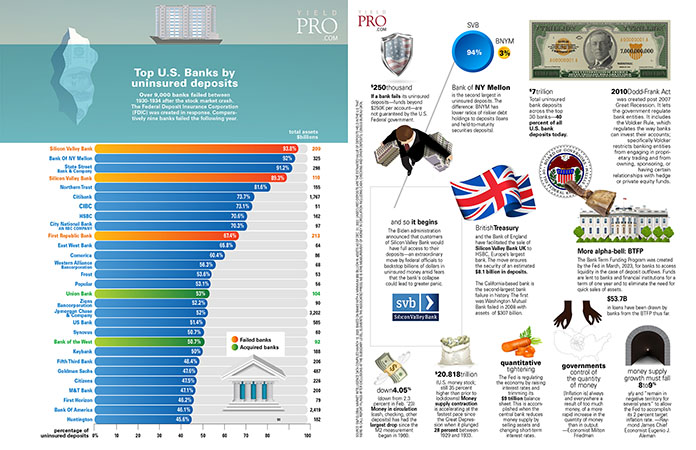
Infographic: Top U.S. Banks by uninsured deposits
Over 9,000 banks failed between 1930-1934 after the stock market crash. The Federal Deposit Insurance Corporation (FDIC) was created in response. Comparatively nine banks failed the following year.
$250 thousand
If a bank fails its uninsured...
Infographic: Pandemic pivot
Lockdowns fueled yet another wave of automation for many property management businesses. AI and 5G are expected to continue the momentum as the internet of things continues to grow and expand.
3 million jobs...
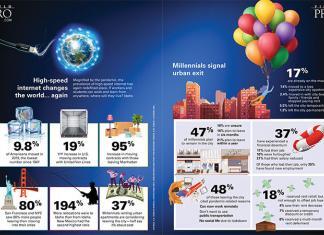
Infographic: High-speed internet changes the world…again
Magnified by the pandemic, the prevalence of high-speed internet has again redefined place. If workers and students can work and learn from anywhere, where will they live? Idaho.
8% of Americans moved in 2019,...
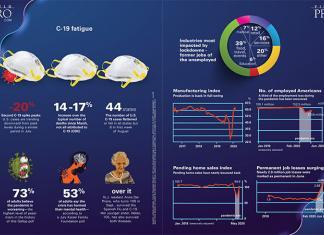
Infographic: C-19 fatigue
-20% Second C-19 spike peaks. S. cases are trending downward from peak levels during a similar period in July
14-17% increase over the typical number of deaths since March, not all attributed to...
Infographic: C19 winners and losers
ZOOM
video conferencing, San Jose, Calif.
$664 million revenue growth May to June, driving Y/Y profits from $5.5 million to $186 million
AMAZON
e-commerce, Seattle, Wash.
$90 billion total revenue Q2, Amazon handled half of...


