Infographic: CRE pivot
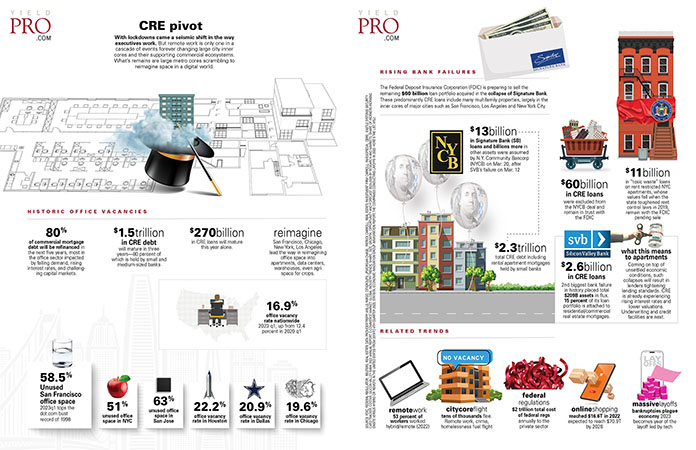
With lockdowns came a seismic shift in the way executives work. But remote work is only one in a cascade of events forever changing large city inner cores and their supporting commercial ecosystems. What’s...
Infographic: Renter nation
12.3 percent of millennial renters plan to always rent—up from 10.7 percent nationally year-over-year.
9.8 percent of the U.S. population moved in the past year—the smallest number since 1948.
17 percent wanted a...
INFOGRAPHIC: Independent contractors targeted
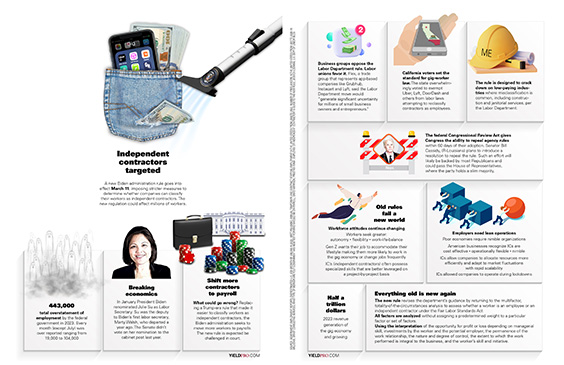
A new Biden administration rule goes into effect March 11, imposing stricter measures to determine whether companies can classify their workers as independent contractors. The new regulation could affect millions of workers.
443,000 total overstatement...
Infographic: The Big Squeeze
It’s hard, even impossible, to resist the siren of the algorithm. The lure of big tech and its promise to improve apartment operations only intensifies.
In turn, big tech is in the business of big...
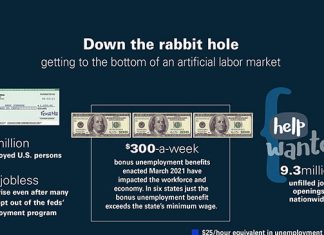
Infographic: Down the rabbit hole
Getting to the bottom of an artificial labor market
3 million unemployed U.S. persons
New jobless claims rise even after many states opt out of the feds’ unemployment program
$300-a-week bonus unemployment benefits enacted...
ISAs set to transform the labor market
Income share agreement (ISAs) fund education. Upon completion, learners pay a percentage of their salary for a term.
Lenders correlate interest rate and pay-back period with borrower’s potential career outcome.
This may mean varying tuitions for...
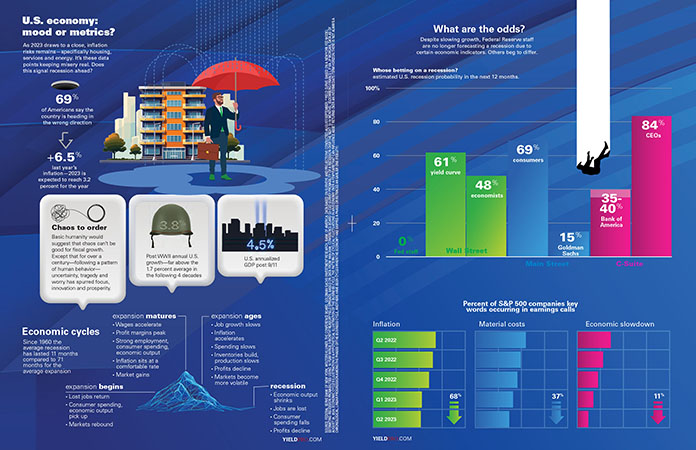
INFOGRAPHIC: U.S. economy: mood or metrics?
As 2023 draws to a close, inflation risks remains—specifically housing, services and energy. It’s these data points keeping misery real. Does this signal recession ahead?
69% of Americans say the country is heading in the...
Infographic: Quantum supremacy
The man in the machine
Programmed by humans, algorithms begin with a logic tree specifying every facet of the code’s behavior from content prioritization to blacklisting. With Google’s near monopoly, what hangs in the...
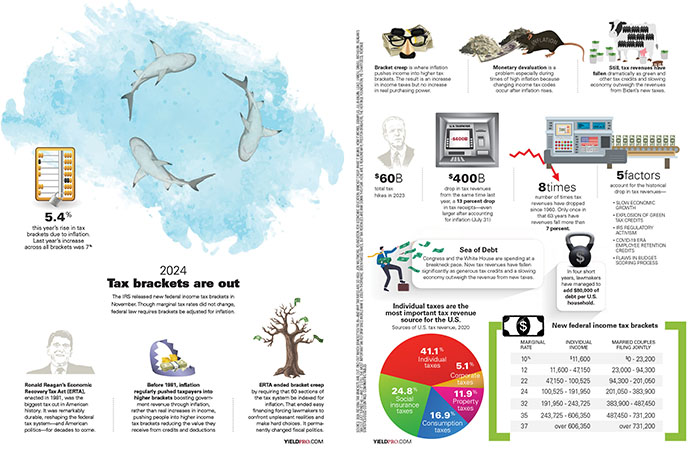
INFOGRAPHIC: 2024 Tax brackets are out
The IRS released new federal income tax brackets in November. Though marginal tax rates did not change, federal law requires brackets be adjusted for inflation.
5.4%
this year’s rise in tax brackets due to inflation. Last...
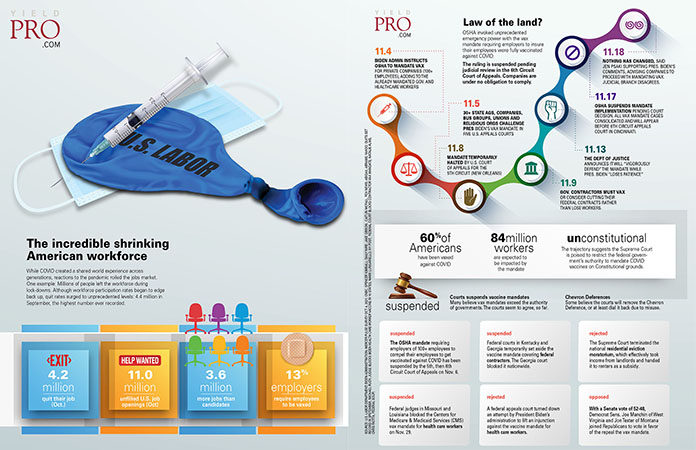
Infographic: The incredible shrinking American workforce
While COVID created a shared world experience across generations, reactions to the pandemic roiled the jobs market. One example: Millions of people left the workforce during lock-downs. Although workforce participation rates began to edge...
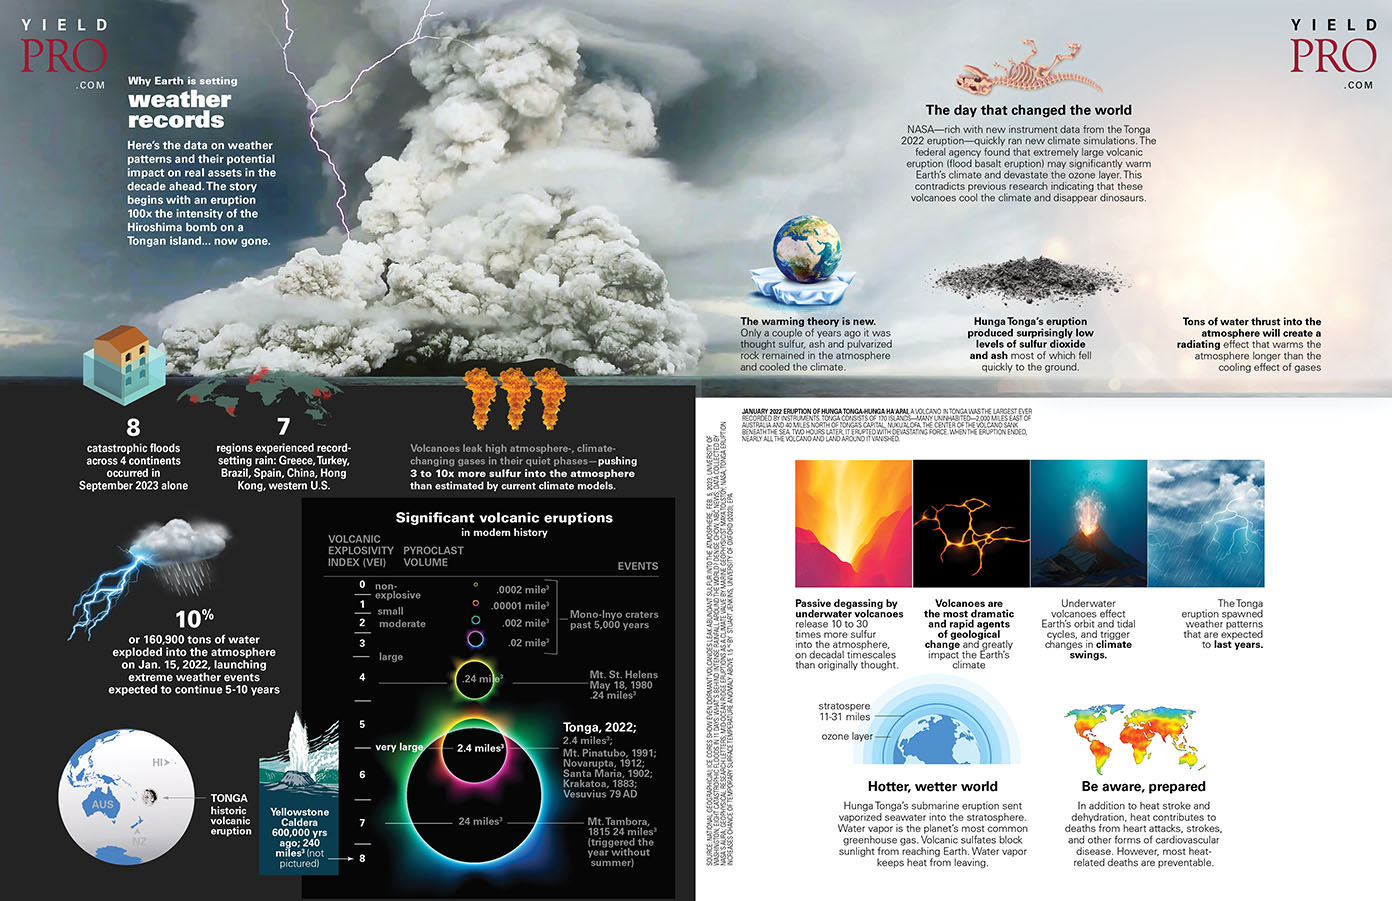
INFOGRAPHIC: Why Earth is setting records
Why Earth is setting weather records
Here’s the data on weather patterns and their potential impact on real assets in the decade ahead. The story begins with an eruption 100x the intensity of the Hiroshima...
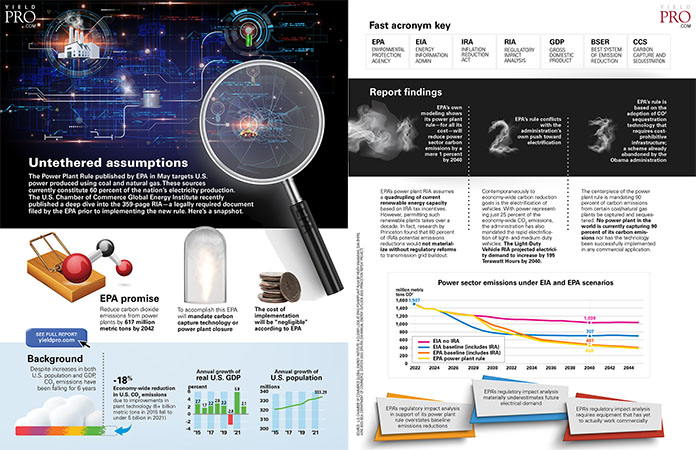
Infographic: Untethered assumptions
The Power Plant Rule published by EPA in May targets U.S. power produced using coal and natural gas. These sources currently constitute 60 percent of the nation’s electricity production. The U.S. Chamber of Commerce...
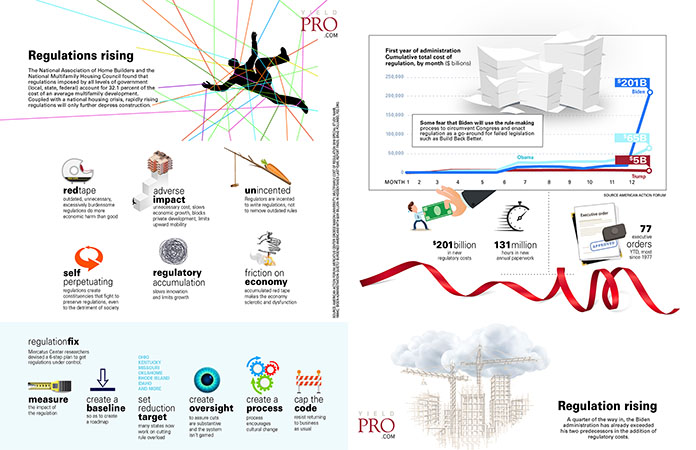
Infographic: Regulations rising
The National Association of Home Builders and the National Multifamily Housing Council found that regulations imposed by all levels of government (local, state, federal) account for 32.1 percent of the cost of an average...
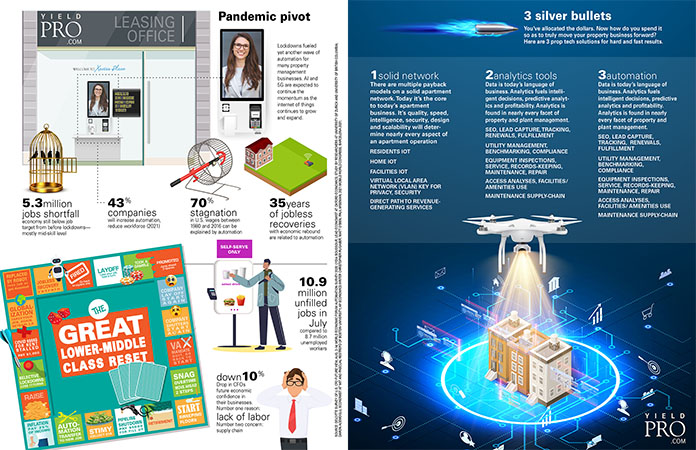
Infographic: Pandemic pivot
Lockdowns fueled yet another wave of automation for many property management businesses. AI and 5G are expected to continue the momentum as the internet of things continues to grow and expand.
3 million jobs...
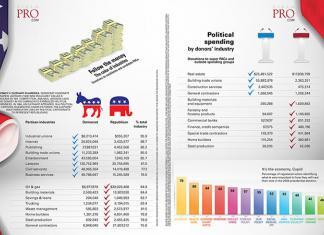
Infographic: Follow the money
The color of industries
Donations to candidates and candidate PACs
Political spending by donors’ industry
Donations to super PACs and outside spending groups
Partisan industries
Democrat
Republican
% total industry
Industrial unions
$8,213,414
$355,207
95.9
Internet
26,825,046
3,433,577
88.7
Publishing
27,887,021
4,452,566
86.2
Building trade unions
11,233,289
1,982,241
85
Entertainment
43,580,054
7,243,169
85.7
Lawyers
130,752,964
30,756,695
81
Civil servants
48,966,264
14,419,488
77.3
Business services
49,788,947
15,245,589
76.6
Oil & gas
$6,977,878
$39,026,468
84.8
Building materials
2,569,423
13,907,030
84.4
Savings & loans
204,540
1,049,993
83.7
Trucking
1,234,077
6,194,015
83.4
Waste management
585,803
2,573,977
81.5
Home...


