Multifamily property management has entered its historical leasing season, which runs from May through September with July and August typically seeing the most volume. But according to a write-up in RealPage Analytic’s Blog, demand patterns during multifamily’s prime leasing season have been altered, most recently by the changes that occurred during the COVID years. Carl Whittaker referred to these changes on his LinkedIn page as, “an echo effect from the pandemic”.
“The peak summer months aren’t garnering the same share of annual demand as history would tell us; instead, the first and fourth quarters are seeing a larger share of calendar year demand,” he said.
RealPage explained that the bulk of 12-month leases historically turn in the summer months and that most renters approximately follow an academic calendar. Those themes still ring true, said the write-up, but the ability of professionals to work from anywhere that began during the pandemic has disrupted historical seasonality.
By analyzing quarterly demand patterns back to 2000, RealPage Analytics discerned a shift in the patterns of prime leasing season demand. In 2023’s prime leasing season—from April to September—the rate of demand diminished, while still accounting for the majority of annual demand.
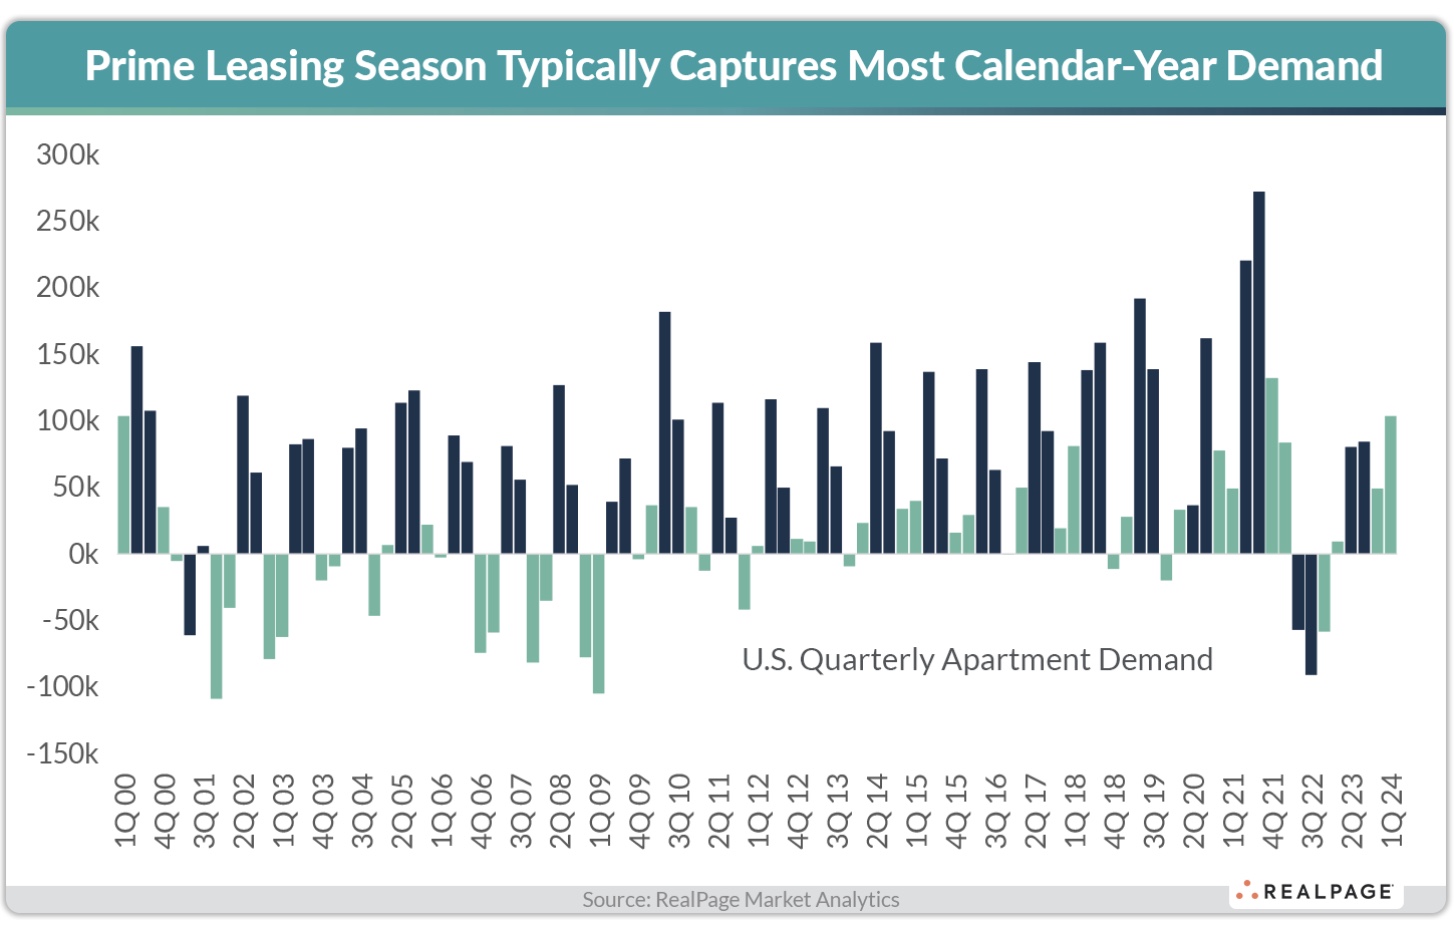
From 2000 to 2013, absorption during prime leasing season easily carried the calendar year’s annual demand. But from 2006 to 2009, the years corresponding to the Great Recession, the only absorption of the calendar year occurred during the second and third quarters, while deep net move-outs were recorded in the first and fourth quarters. This made any demand during prime leasing season seem severe by comparison.
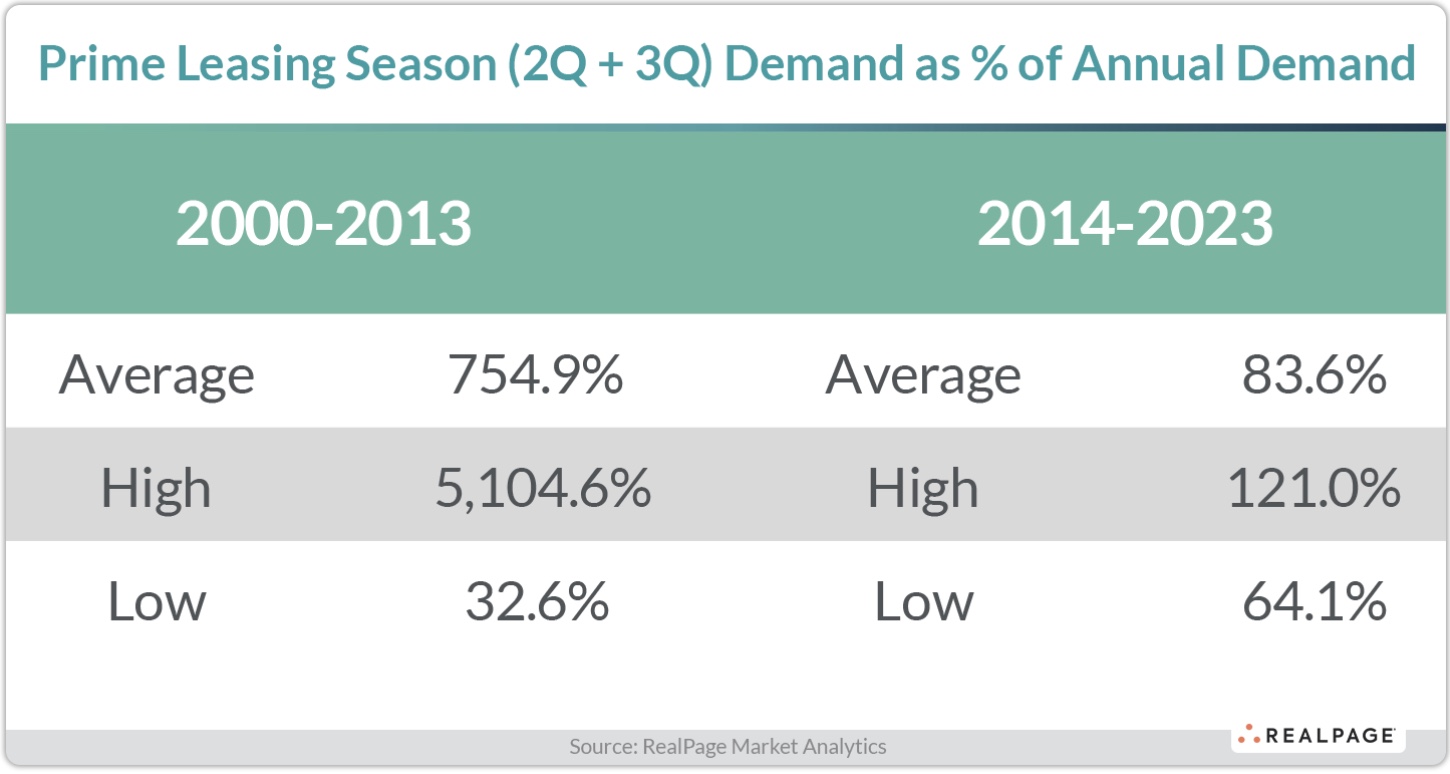
“Due to that deep dichotomy during those years, prime leasing season demand ran as high as 5,000 percent higher than annual demand,” said RealPage.
Positive absorption in all four quarters of the calendar year was only recorded in four years (28 percent) during 2000 to 2013. By comparison, positive absorption in any given quarter was more common from 2014 to 2023. Positive absorption has been recorded in all four quarters of the calendar year in only six of the last ten years, most recently in 2023, said RealPage.
“Even in years where all four quarters recorded some absorption (which happened in ten of the last 23 years), prime leasing season demand could account for over 90 percent of annual demand. That happened in 2012 when annual demand clocked in just below 184,000 units – about 166,000 units of which were absorbed in the second and third quarters,” wrote RealPage, adding that seasonality still exists, but it looks more muted than in previous decades.
Over the last decade, 1st quarter demand over the past ten years averaged only 12 percent of annual demand, negating the extreme outlier year of 2022.
So what should operators expect this year?
Assuming that 2024’s Q1 demand should account for approximately 12 percent of annual demand, that translates to another 760,000 units to be absorbed in the remaining three quarters of the year. “That seems a tall order as concurrent apartment supply from the second third and fourth quarters should total about 530,000 units,” said RealPage.
Whittaker went deeper, looking at what share of a typical year’s demand happens by quarter, by market.
The graph below shows the nation’s 50 largest markets and what share of a given calendar year’s worth of demand happens in a specific quarter, while the markets are shaded darker (more seasonal) to lighter (less seasonal), he explained.
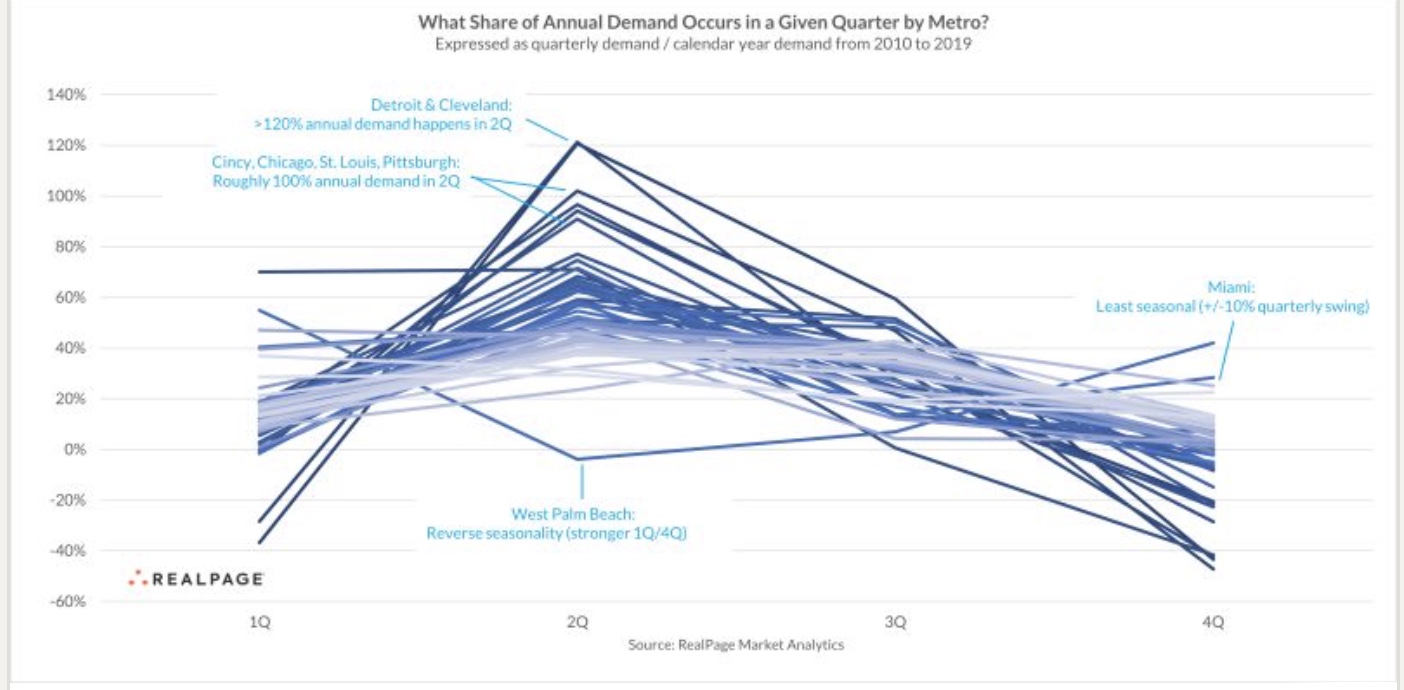
“If you’re in Detroit or Cleveland, then you’re familiar with the second quarter demand surge. In fact, more than 100 percent of your annual demand happens in Q2. How can a quarter be greater than 100 percent? That means your other quarters, particularly the first and fourth quarters, see negative absorption, or move-outs,” he wrote.
Because the Midwest markets see most of their annual demand figure happen in the second quarter, Whittaker recommends a leasing strategy tailored to converting leads into leases during that window, “because if you miss the boat, then it’s going to be hard to convert non-existent leads from the winter months,” he said.
West Palm Beach bucks the trend by posting its weakest absorption in Q2, said Whittaker, calling it more a case of reverse seasonality, since the area relies on demand from snowbirds moving into warmer weather areas during the winter.
“Interestingly enough, Miami is the nation’s least seasonal market (at least as defined by this particular analysis). Peak quarters in Q1 and Q2 see about 30 percent of the annual total.
Miami’s ‘off’ season, if you even want to call it that, he said, is in Q3, which captures about 20 percent of the annual total. With a +/-10 percent absorption swing from peak to trough, Miami is one of the few markets where seasonality barely comes in to play at all. Two other markets without significant on/off seasons are Phoenix (+/-20 percent quarterly swings); Raleigh/Durham and DFW (+/-25 percent), said Whittaker.


(4) New Construction Loan for Market Rate Multifamily Property Pueblo Springs in Pueblo Colorado")