When there is no middle class, and the poor greatly exceed in number, troubles arise, and the state soon comes to an end. – Aristotle
While the American Dream may be homeownership, for more and more of us, the current American reality is renting. More than 43 million U.S. residents rent, according to the Census Bureau, growing at a rate double of what we saw just decades ago.
According to the newly released America’s Rental Housing 2017, a deep dive into the country’s housing market, the growing number of apartment dwellers are finding a much more unequal market at play. The rich are getting more options, while affordability rises and the stock of affordable homes (and housing assistance) shrinks.
The intro to the report is blunt. The housing market, which responded to a decade of broad-based growth and increasing apartment demand with a sharp increase of high-end units, stoked the affordability crisis, where “part of the new normal emerging in the rental market is that nearly half of renter households are cost burdened.”
The American rental market has reached the end of a wave, which started in 2004, when a sharp drop in national homeownership began, to now, when the past decade-plus of rising demand for rental units has finally cooled off. Increasingly, high prices and affordability challenges are the norm.

A tale of two rental markets
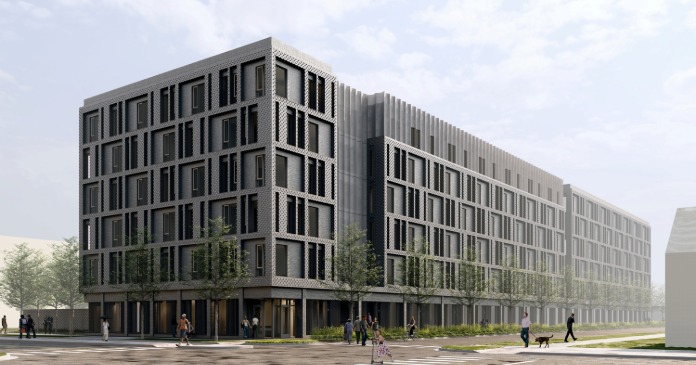
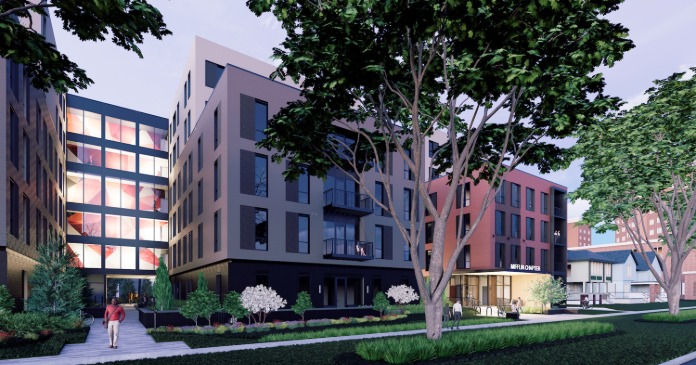
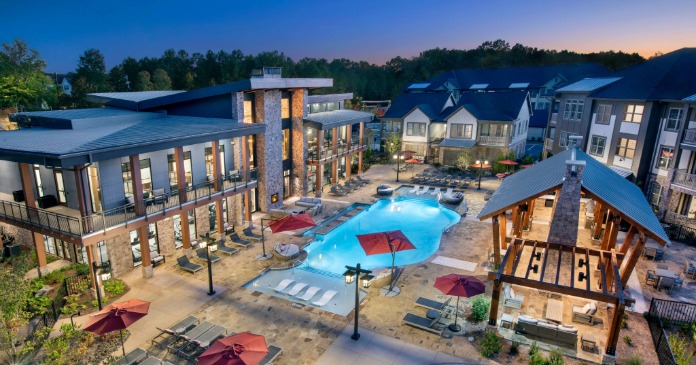
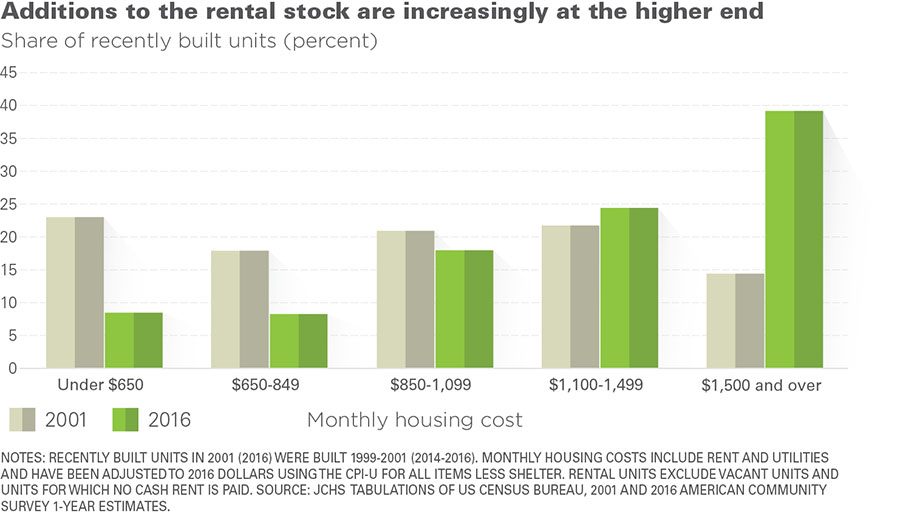
For high-end renters, who make up an increasingly larger share of renters, today’s market is all about choices. If you walk through one of the hotter neighborhoods in your city, amazed that another high-end rental building is going up, you’re not crazy. High-end units have been constructed at a furious pace to feed a growing customer base.
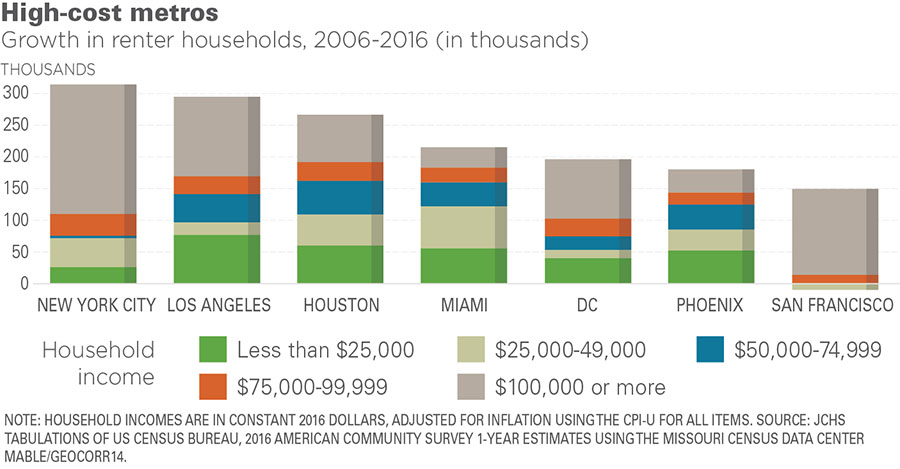
Since 2006, 2.9 million new renters making $100,000 or more entered the apartment market, many choosing to live in expensive downtown apartments. Over the last decade, 65 percent of new renter households in New York City, and 93 percent in San Francisco, brought home over $100,000 a year.
Developers, hungry to cater to this expanding high-end market, have, in part, helped fuel a price spike. Recent apartment construction has favored desirable central cities: between 2013 and 2016, nearly 60 percent of unfurnished new units were built in the principal metro areas of cities, a 10 percent jump from the previous decade.
Since land is limited in these desirable areas, land prices, costs, and ultimately rent, have gone up, explaining the 15 percent rental premium now seen between cities and suburbs. There are even strong signs developers overbuilt for this market segment: according to the Survey of Market Absorption, 10 percent of rentals completed in 2015 and priced at more than $2,450 remained vacant after 12 months. In contrast, only 2 percent of units with rents below $1,250 were still unfilled within one year.
The focus on downtown helped boost the median asking rent for a new apartment 27 percent between 2011 and 2016, resulting in a nationwide average rent of $1,480 a month. That may seem reasonable or ridiculous, depending on where you live. But based on the standard measure of affordability—a household should spend 30 percent of income on rent—you’d need to make $59,000 a year to move into this average apartment, more than $20,000 more than what the average renter makes ($37,300).
Choices for the high-end of the market do not mean more choices for lower cost rental housing. Rising prices and demand has helped make life for low-income renters increasingly challenging. The share of units renting for $850 or less shrunk from 40 percent of the total supply to 20 percent of the total supply in the last decade.
The inequality between these groups of apartment dwellers has many causes, but a big one is construction cost. When it’s harder to turn a profit, with land and labor costs skyrocketing—the price of vacant commercial land rose 62 percent between 2012 and 2017—it makes sense that the market would focus on expensive, amenity-laden buildings that can demand enough of a premium to cover costs.
Many struggle to pay rent
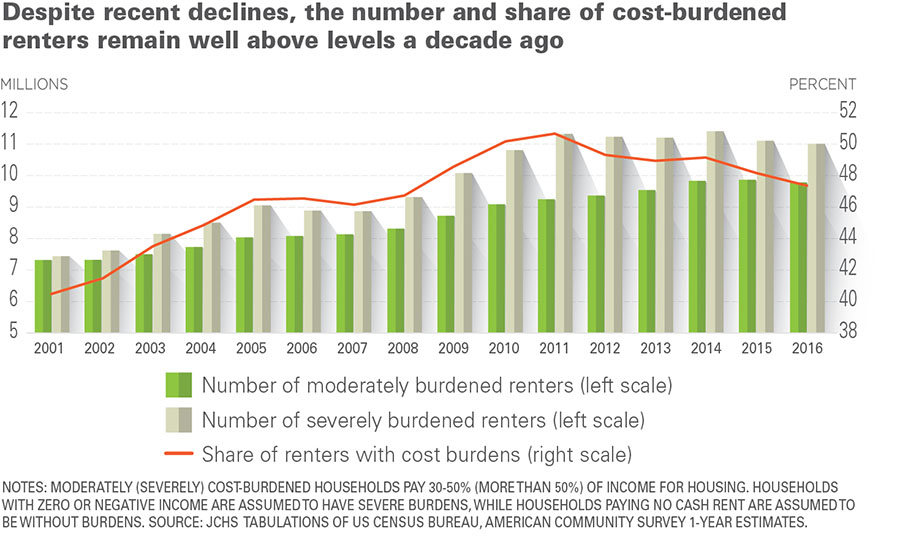
Against a backdrop of rising rents, low-income households have seen more of their incomes go to their landlords. Wages haven’t come close to keeping pace with housing costs: between 2001 and 2011, median rental housing costs rose 5 percent, while median renter incomes actually dropped 15 percent. While the number of cost-burdened renters nationwide receded from a high mark of 21.3 million in 2014 to 20.8 million in 2016, it’s still higher than it’s been for years. More recent statistics show low-income renters still may feel stuck, with their housing dollars covering less and less.
Over the last six years, increases in the median rent have exceeded inflation for non-housing expenses by one percent each year. And it’s even worse in hot markets: median rents have risen at twice the national pace in cities such as Austin, Denver, and Seattle, where—to make it even more challenging—rent in low-cost neighborhoods has also risen a full percentage point more than in high-cost neighborhoods. If a low-income renter decided to move to a booming city to make more money, they’d likely come up against the harsh reality of surging housing costs. More than half of renter households in the country’s nine largest metros are cost-burdened.
What’s even more imposing is just how much of many American’s salary goes to rent each month. In 2016, the median renter in the bottom income quartile had just $488 per month to spend on other essentials, a full 18 percent less than in 2001, after adjusting for inflation. That means less to spend on food, medicine, and transportation (which costs more when you need to settle for a less expensive unit further from work). Renters in the lowest income group spend 17 percent of their incomes on utilities, while those in the highest-income households spend only 2 percent.
The increasing slice of family income going toward housing explains why the median net worth of renter households was only $5,000 in 2016, according to the latest Survey of Consumer Finances. Homeowners have a comparatively otherworldly net worth of $230,000 on average.
Government doing less to help
It’s not an exaggeration to call the lack of affordable housing a pressing problem, even a crisis. But if you judged the federal government’s response to this issue by its budget, you might get the opposite impression. The need for new affordable housing, and housing assistance, simply isn’t being met.
The Department of Housing and Urban Development’s own Worst Case Housing Needs 2017 Report to Congress did note that the number of very low-income households receiving rental assistance increased by 600,000 from 2001 to 2015. But during that same stretch, the number of very low-income households (making less than 50 percent of area median) grew by 4.3 million. That meant the share of the at-need population receiving aid fell from 28 to 25 percent. Concurrently, the number of households facing “worst-case needs,” defined as putting more than half their paycheck toward rent and/or living in severely inadequate units, jumped from 34 to 43 percent.
And sadly, due to both the rise of the low-income population in this country, and increased development costs for new housing, inadequate is a very accurate word for describing the nation’s stock of affordable homes.
We’re simply not repairing what we have. HUD estimates that 93 units are affordable for every 100 very low-income renters, but of these, only 54 are both available and adequate. The nation’s public housing faces a deferred repairs backlog of $26 billion (last estimated in 2010, so it’s likely much worse).
Part of the reason it’s so important to maintain our affordable public housing is that naturally occurring affordable units have been disappearing at an alarming rate. Roughly 60 percent of the 15 million rentals affordable in 1985—8.7 million units—were lost by 2013, according to Hudson Institute research, due to permanent removals and demolitions, conversions, and gentrification.
It’s also increasingly expensive to add new supply. An estimate from RS Means found the costs of building a simple, three-story apartment building, the type that has historically provided a lot of the existing affordable rental stock, jumped 8 percent from 2016 to 2017 alone, and between 2012 and 2017, the cost of construction labor, and contractor fees rose 25 percent.
This lack of updates or additions means much of the affordable stock is what’s charitably referred to as “naturally occurring affordable rentals,” or older buildings that have often become cheaper due to aging and obsolescence. Only a fifth of existing units rent for under $850 a month, and nearly half of those were built before 1970. The lack of construction has meant our building stock as a whole is aging. The median age of an occupied unit in 2015 was 42 years, a stark difference from 1985, when the average age was 23.
While the price of construction materials is out of the hands of local policymakers, they do have a number of levers to pull to get more affordable units built: they can “determine the amount of land available for high-density development, the process needed to gain approvals, and the characteristics of housing that is allowed—all of which help determine the amount, type, and cost of the housing that is built,” according to the report. While the affordable housing challenge has many causes, this report offers evidence that it should continue to be a top issue locally and nationally for years to come.
Excerpt: Patrick Sisson, Curbed


