The US Bureau of Labor Statistics recently released a report on the characteristics of minimum wage workers. The report focused on workers paid at hourly rates and looked at their wages when compared to the federal minimum wage, which currently stands at $7.50 per hour. Because many states have minimum wages which are higher than the federal level, it is impossible to tell from the report how many workers are making the minimum wage for their locality. However, relative comparisons between workers based on things like age or education can be made.
Note that the report only covers workers paid hourly wages and does not consider overtime pay or tips. Hourly wage workers comprise a little over 58 percent of all hourly and salaried workers. The report also does not include people who are self-employed.
The report is based on a survey of 80,439 workers, 1824 (2.3 percent) of whom received hourly wages at or below the federal minimum wage. In the following charts, the values on the Y axis are the ratio of the rate of workers in a sub-group whose wages were at or below the federal minimum wage to the overall average rate for all workers surveyed. So a “3” means that three times as many workers in the group were at or below the minimum wage than the average for all workers in the survey.
Experience matters
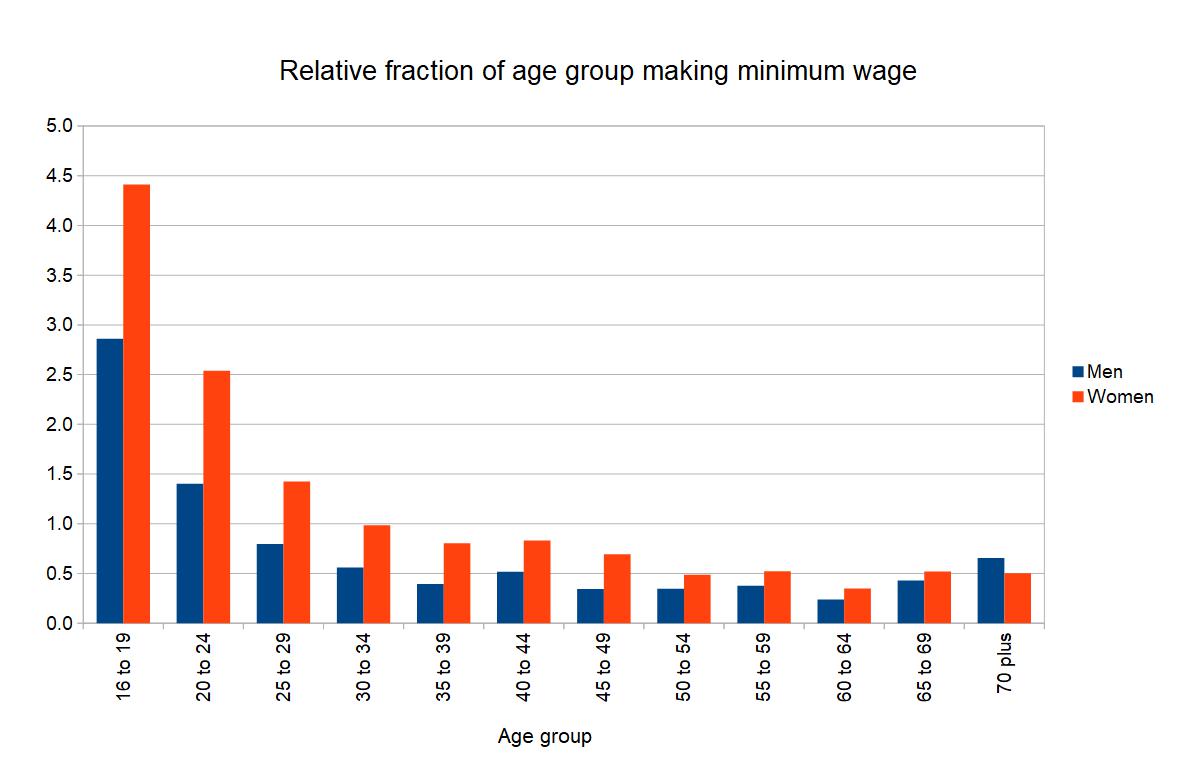
The first chart looks at the effect of age and gender on the rate of workers in jobs paying the minimum wage or below. It shows that women are more likely to work minimum wage jobs than men. It also shows that the rate at which people earn minimum wage is strongly correlated with age. As workers gain experience, they are much more likely to earn more than the minimum wage.
Education matters too
The second chart looks at the effect of education level on the rate of workers receiving minimum wage or below. In general, the more education that a worker has, the more likely he is to earn above this level. An exception to this rule is people who attended college for a time but did not receive a degree. They are more likely to be earning at or below minimum wage than people who graduated from high school but did not attend college at all. Perhaps this reflects the importance of finishing.
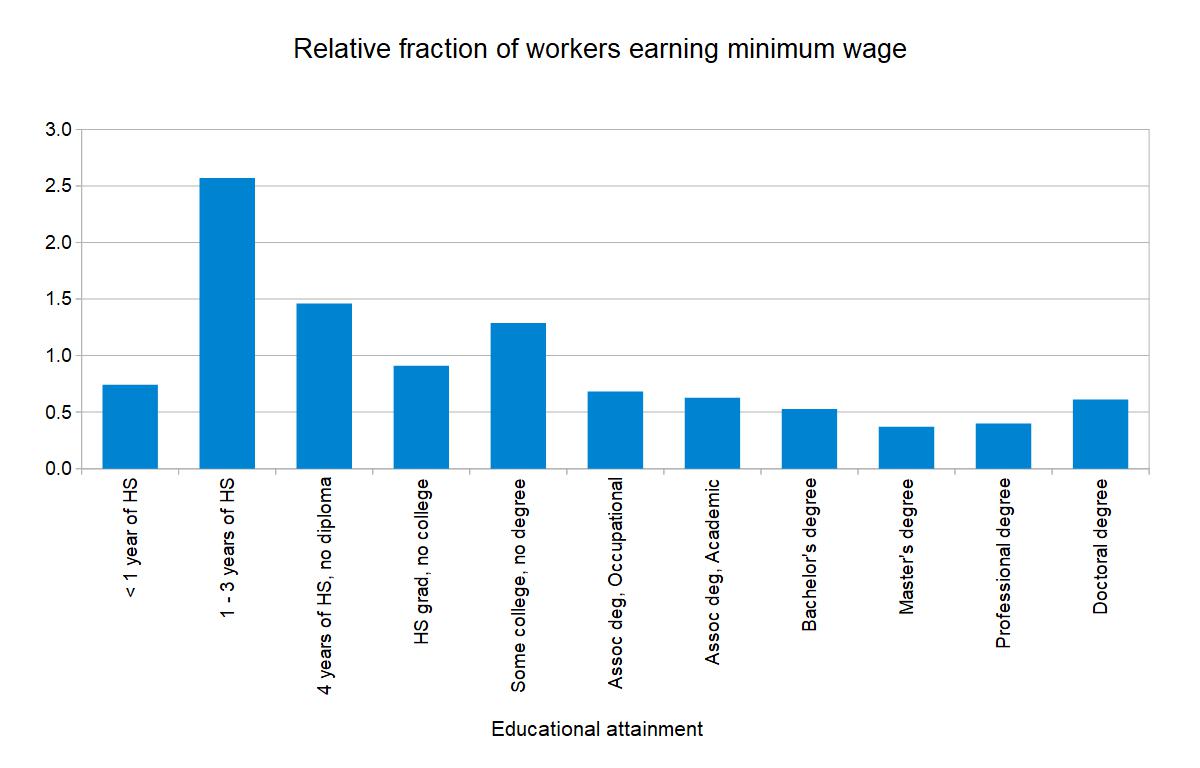
While the above chart includes people with 4 year college degrees or higher, it only includes the ones who are being paid hourly. Many of the people at these education levels will be part of the 42 percent of workers who are paid salaries and so are not included in this survey.
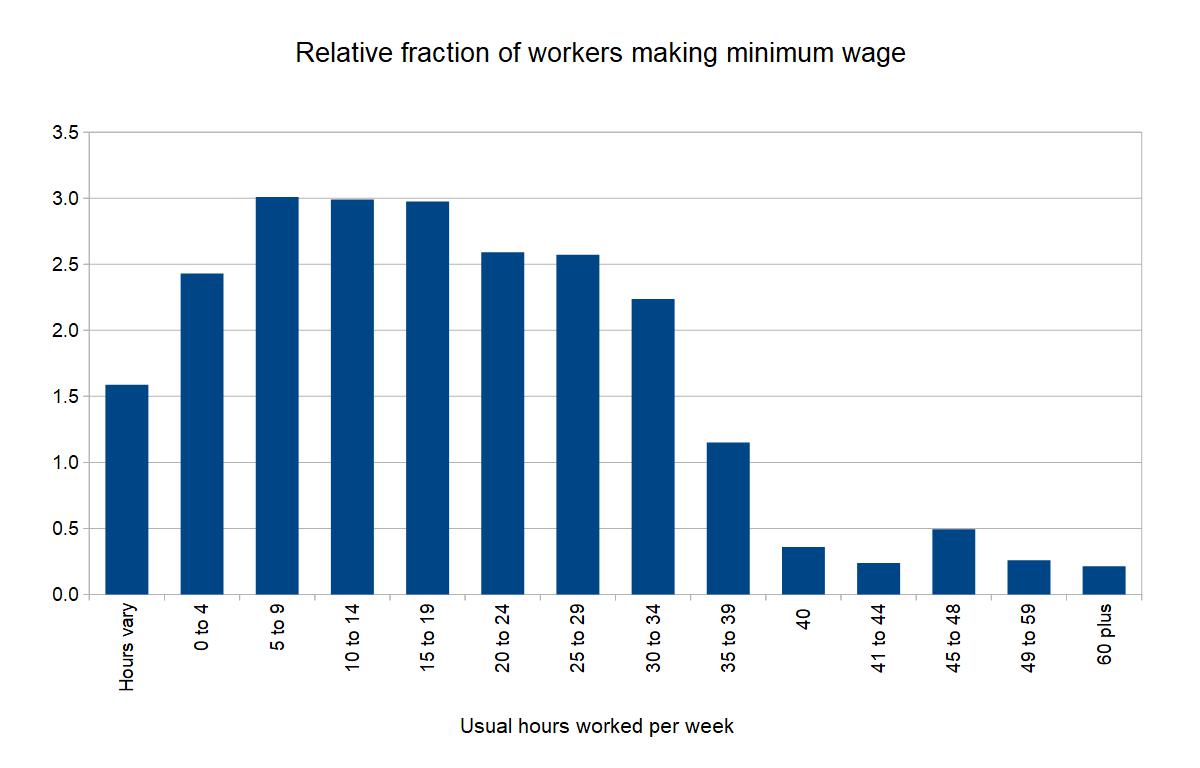
Full-time vs. part-time
The final chart looks at the effect of how many hours worked per week on the rate of workers earning at or below minimum wage. It shows that people working part time are much more likely to fall into this group.