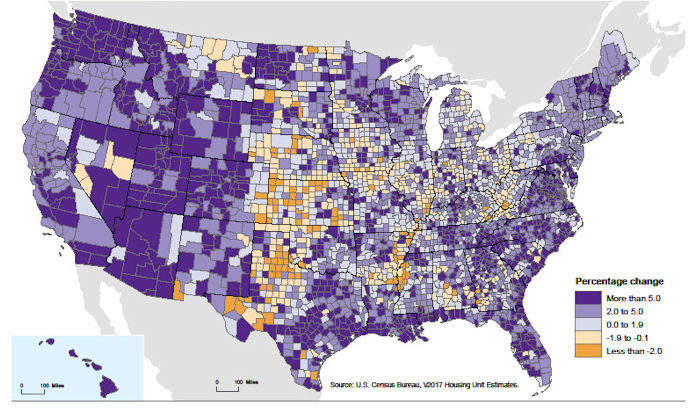
On May 24, the Census Bureau released its estimates of the number of housing units versus the population of the United States by region. The data give a clue to housing availability in the states and to how it has changed since the last decennial census in 2010.
Where population is surging
Rapid population growth will continue to place pressure on housing inventory. Texas and North Dakota topped the list with the highest rate of population growth since the 2010 census.
| State | Population growth |
| Texas | 12.6 |
| North Dakota | 12.3 |
| Utah | 12.2 |
| Florida | 11.6 |
| Colorado | 11.5 |
| Nevada | 11.0 |
| Washington | 10.1 |
| Arizona | 9.8 |
| Idaho | 9.5 |
| South Carolina | 8.6 |
How is housing availability?
In order to get an idea of the housing availability in each state, we took a look at the number of people per housing unit. This is an imperfect measure of housing availability since differences in household size also plays a role in determining how many people reside in each housing unit. Nevertheless, the top ten states ranked by people per housing unit is shown below.
| State | People per housing unit |
| Utah | 2.86 |
| California | 2.79 |
| Hawaii | 2.63 |
| Texas | 2.59 |
| New Jersey | 2.49 |
| Maryland | 2.47 |
| Georgia | 2.44 |
| Virginia | 2.41 |
| Nevada | 2.40 |
| Washington | 2.39 |
How is it changing?
In order to get an idea of which states are doing a poor job in building enough housing units to keep up with their population growth, we looked at how the number of people per housing unit (PPHU) has changed from its level at the 2010 census. The states with the highest growth in PPHU are shown below, along with the percent growth since the 2010 census. Exactly half of the states had higher rates of growth in housing than they did in population, resulting in fewer people per housing unit in 2017 than in 2010.
| State | PPHU growth % |
| Florida | 6.27 |
| Nevada | 4.28 |
| Arizona | 4.11 |
| Colorado | 3.43 |
| Georgia | 2.80 |
| Texas | 2.73 |
| Oregon | 2.45 |
| Washington | 2.41 |
| California | 2.41 |
| Maryland | 1.82 |
Where housing supply growth is strong
Finally, those states with the highest growth in the number of housing units since the 2010 census are listed below. While North Dakota had the second highest rate of population growth for any state, it also had the highest rate of growth in the supply of housing units. This meant that the state’s per capita supply of housing actually improved. It was the only one of the fastest growing states where this was the case. While 6 of the 10 fastest growing states by population were also on the list of of the 10 with the fastest growth in the number of housing units, none of the others improved their per capita supply of housing units.
| State | Housing supply growth % |
| North Dakota | 18.0 |
| Utah | 10.7 |
| Texas | 9.6 |
| Idaho | 8.1 |
| South Dakota | 8.0 |
| Colorado | 7.8 |
| Washington | 7.5 |
| South Carolina | 6.9 |
| North Carolina | 6.8 |
| Delaware | 6.7 |


