Marcus and Millichap (M&M) recently released their 2019 Multifamily North American Investment Forecast report. It expands on the webinar they presented two months ago. While this report covers the usual operational factors like rent growth and cap rates, it seems much more targeted at real estate investors than year-ahead reports from other sources.
Diving into the details
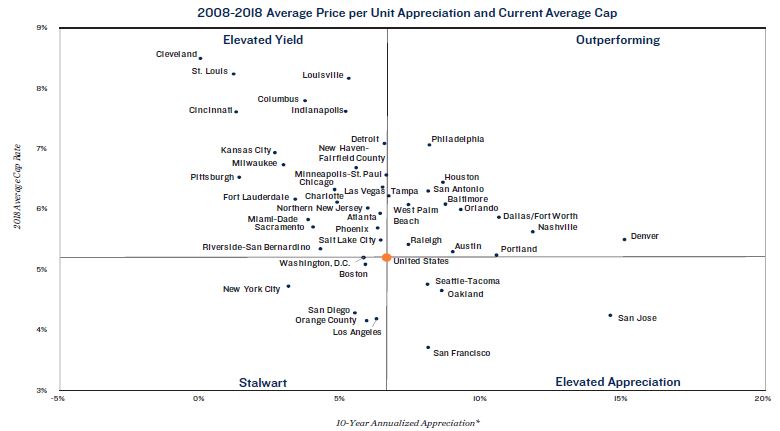
M&M’s webinar, which we covered earlier, gave an overview of the state of the housing market. This follow-up report goes into a lot more detail, providing data on 46 major metro areas in addition to the national data. The following chart is an example of the data presented in the report:

The chart plots current average cap rates for selected metro areas against the average annual price appreciation of properties in those markets over the last ten years. It shows that there have been large variations in how individual markets have behaved over that time. Some markets, like Cleveland, have had very little price appreciation and have managed to maintain high cap rates. Some markets, like San Jose, have seen rapid property price increases and this has driven down cap rates.
Observations from the data
While choosing a ten year period over which to do a comparison is natural, the market in 2008 was being roiled in the wake of the financial crisis. It will be interesting to see if the trends illustrated in this chart are maintained when the base year of the comparison is more ”normal”.
Some observers of the multifamily real estate market tend to liken commercial property to bonds. The cap rate is like the bond yield. Under this model, it makes sense to talk about the spreads of cap rates over Treasury yields as a measure of the market’s appetite for risk. However, one could also conclude from the above chart that multifamily real estate can be likened to stocks. Some stocks, think utilities, are sought primarily for their dividend yield while others, think tech, are sought for their potential for price appreciation. In this analogy, Cleveland is a utility while San Jose is a tech. Investors may choose one type of market over another depending on what are their goals.
Pulling it all together
M&M attempts to create a single measure of the investment potential of individual property markets with something they call the National Multifamily Index (NMI). The index is derived from “forward-looking economic indicators and supply-and-demand variables.” Heading into 2019, the top market by this measure is Minneapolis-St. Paul. It is followed by San Diego, New York City, Los Angeles and Seattle-Tacoma. At the bottom of the list is St.Louis, followed by Louisville, Baltimore, Cleveland and Kansas City.
Of course, the report includes the disclaimer that bad deals can be found in good markets and good deals can be found in bad markets.
The report includes much more than can be covered here, including commentary on factors affecting the multifamily real estate market and a full-page review of each of the 46 US and 3 Canadian sub-markets it covers. The full report can be found here.


