It’s a perfect storm for raising rental costs: low vacancy rates not seen in decades, an influx of high-income renters, constraints on building new apartments and homes, and the disappearance of low-cost rental units.
A new report from Harvard’s Joint Center for Housing Studies on the nation’s rental markets suggests the ongoing affordable housing crisis has evolved, with a growing number of well-to-do renters increasingly putting a strain on low-income, and increasingly middle-income, renters.
“Despite the strong economy, the number and share of renters burdened by housing costs rose last year after a couple of years of modest improvement,” said Chris Herbert, managing director of the Joint Center for Housing Studies. “And while the poorest households are most likely to face this challenge, renters earning decent incomes have driven this recent deterioration in affordability.”
A marked shift in who rents
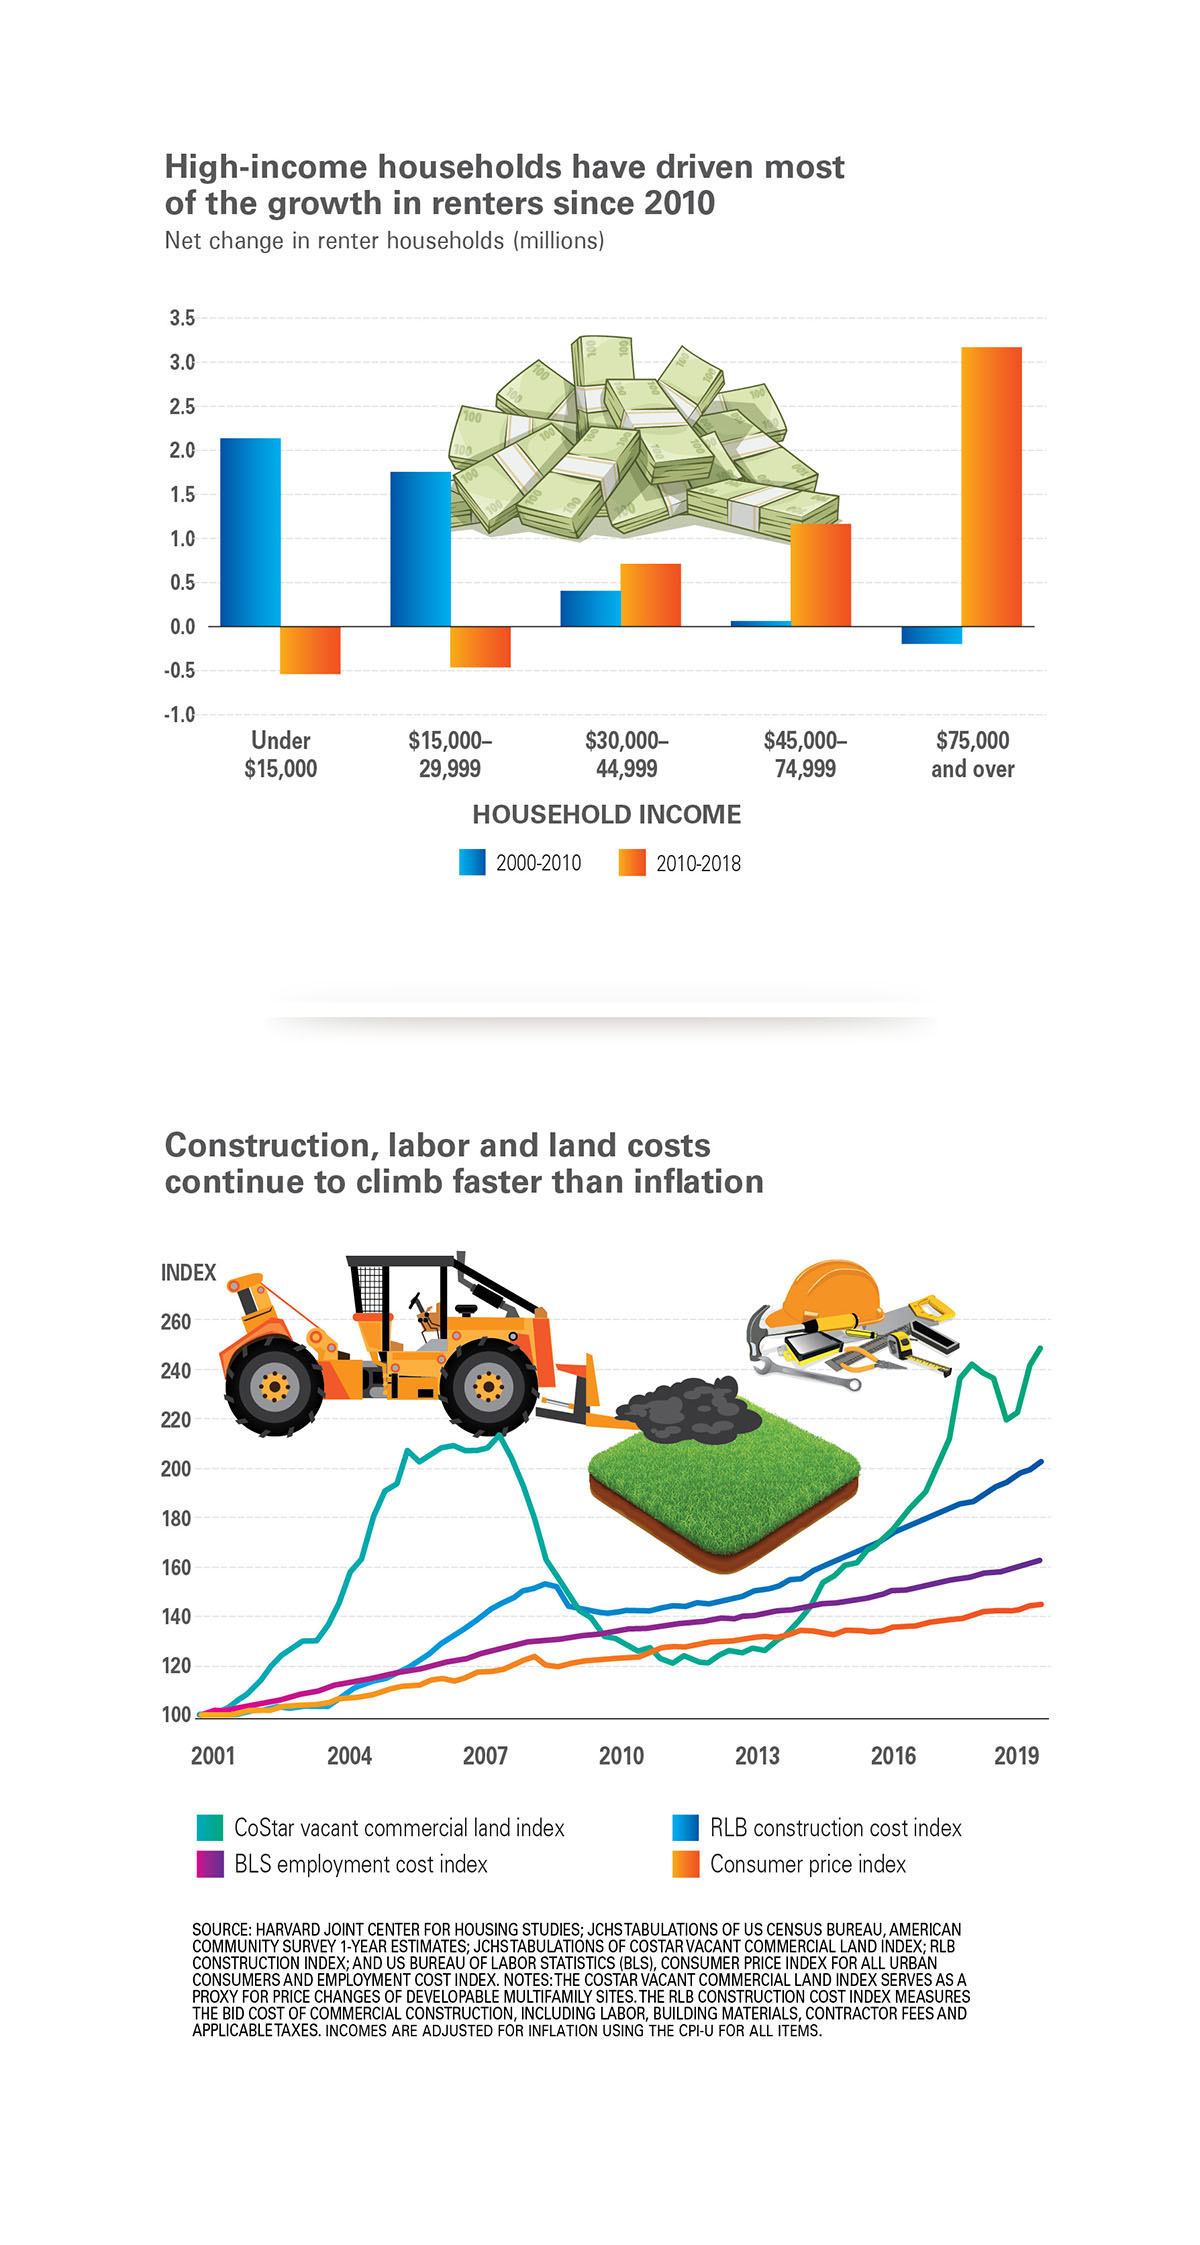
Perhaps the most significant change in the nation’s rental landscape is the shift in just who is renting today. The rental market has welcomed increasing numbers of high-income renters, with the percentage of renter households making $75,000 or more in 2019 hitting 22 percent, the highest level on record.
That’s indicative of a huge change in the makeup of U.S. renters. The number of high-income renter households rose by 45 percent between 2010 and 2018, while the share of low-income renter households, defined as those making under $30,000, declined by a little more than 5 percent—a reduction of nearly one million households.
“Young, college-educated households with high incomes are really driving current rental demand,” says Whitney Airgood-Obrycki, research associate and a lead author of the report.
Some of this shift comes from the relatively high cost of homeownership today, which is creating a barrier to buying property for more and more Americans, as well as pushing higher-income families who in the past might have bought a home into the rental market. Many of the groups stereotypically assumed to favor owning versus renting have become renters.
Data from the U.S. Census Housing Vacancy Survey show that between 1994 and 2019, there was a marked increase in renting among middle-aged families: 4.5 percent more of those between the ages of 35 and 44 and 5.3 percent more of those 45 to 54 were renters compared to 25 years previously. Concurrently, the number of married couples with kids who rented skyrocketed, shooting up 680,000, or 14 percent, between 2004 and 2018, to a total of 5.9 million.
As the number of wealthier renters has increased, those renters have also become more wealthy. The Harvard study notes that, according to the latest Current Population Survey, the average real income of the top fifth of renters rose 40 percent over the past 30 years. At the same time the bottom fifth saw their income shrink 6 percent. It’s a growing gap underscoring the nation’s increasing income disparity: Three decades ago, that top fifth of renters made 12 times more than the bottom fifth; today, it’s 18 times as much.
The rental market reacts to more moneyed tenants
The composition of the nation’s rental stock has shifted in profound ways as well, often in reaction to the growing number of well-heeled renters. Overall, rental stock in the U.S. has been shifting toward two types of rentals: large multifamily buildings and single-family rental homes together accounted for 87 percent of the overall growth in the rental stock between 2008 and 2018. During that same 10-year period, the number of units in multifamily buildings with 20 or more units jumped 31 percent (to 10.6 million total), mostly in medium- and high-density neighborhoods. The number of single-family rental homes grew 18 percent (15.5 million).
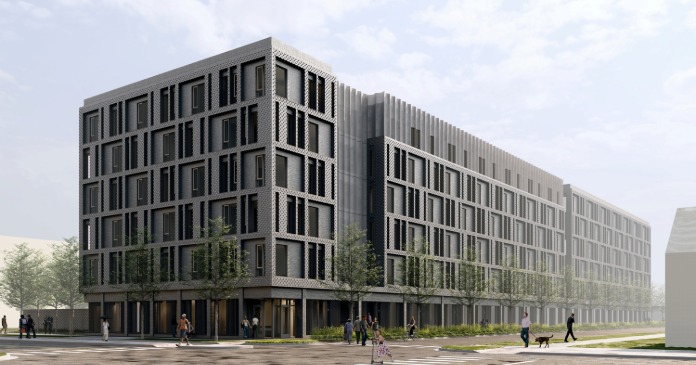
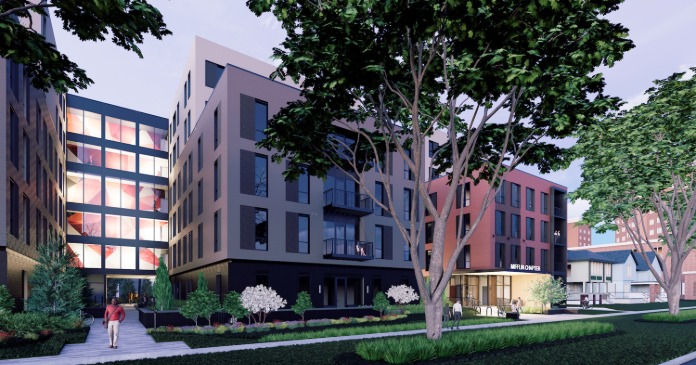
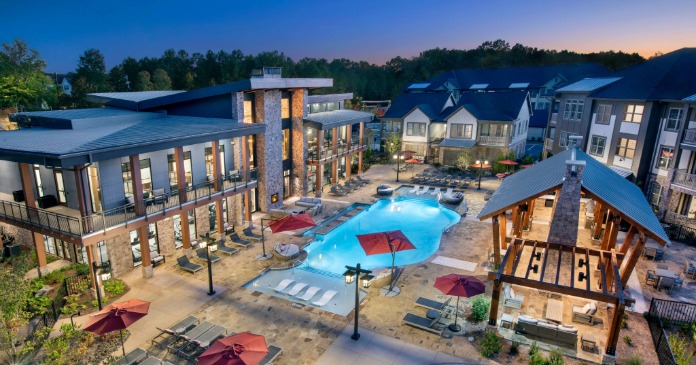
In short, more apartments are for rent in walkable, desirable, and expensive urban areas, while there are also more home rental options for families that can’t or don’t want to own. As the report notes, when discussing this new wave of downtown apartments, “these new units typically offer amenities, including locations in the core parts of metro areas, that put their rents out of reach for even middle-income households.”
The cost of these new units also reflects the changing demographics of American renters. The national median asking rent for unfurnished apartments finished between July 2018 and July 2019 was $1,620 a month, or 37 percent higher, in inflation-adjusted dollars, than the median for similar units completed in 2000. During that same July 2018 to July 2019 time period, roughly 20 percent of newly built apartments had a rent of $2,450 or higher, while just 12 percent were asking for $1,050 or less.
A building boom, but not enough to lower rents
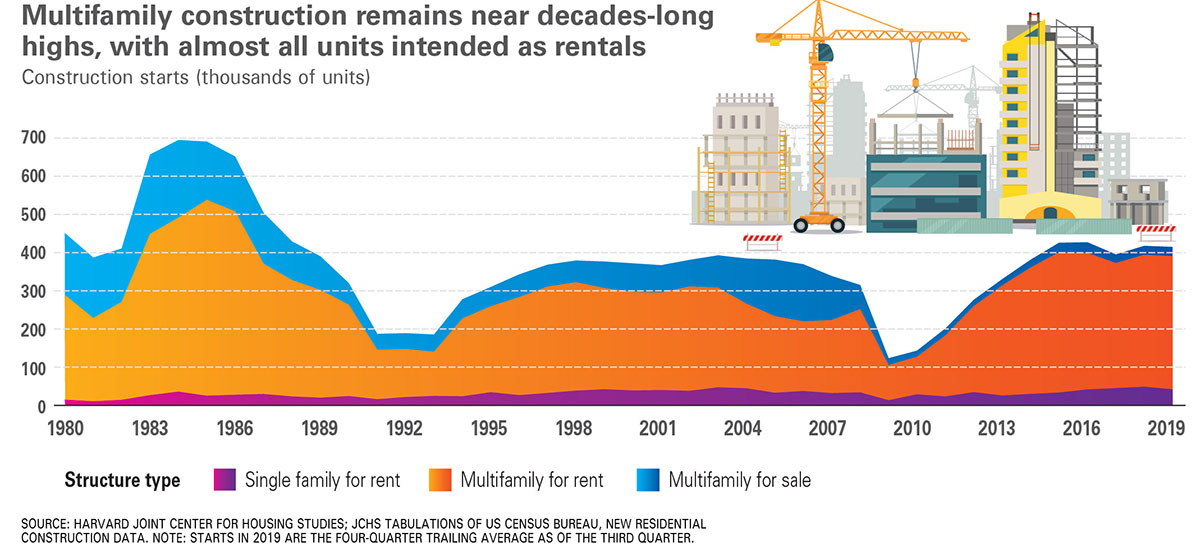
New rental construction, currently hovering at or near the highest levels seen in the past three decades, has been booming for years. In 2018, developers broke ground on buildings that will contain 374,100 units when finished, a 6 percent increase from the year previous. Final 2019 numbers are expected to show an equal or larger number of new units on the way.
But despite all this construction activity, there’s still a significant need for more housing, especially affordable housing, which is rapidly disappearing. Between 2012 and 2017, the number of units renting for $1,000 a month or more (in 2017 dollars) grew by 5 million, while the number of low-cost units, those renting for $600 or less, shrank by 3.1 million. The supply of low-cost units nationwide has dropped from 33 percent of the nation’s overall housing stock in 2012 to 25 percent in 2017.
Why the mismatch between the increased construction activity and the increasing demand for affordable units? In many cases, developers are building in the dense, expensive urban areas where the growing cohort of high-income renters want to live, which results in higher cost fueled in part by a dramatic increase in construction costs.
Developers face higher costs across every stage of the development process. Between 2012 and mid-2019, the report notes, the Rider Levett Bucknall Construction Cost Index, which factors in the cost of labor, materials, contractor fees, and local taxes, skyrocketed by 39 percent.
Land prices have seen a similar surge in value. The cost of vacant commercial land nearly doubled between 2012 and 2018. The shortage of construction workers has also gotten worse. The industry was trying to fill 300,000 job openings in 2019, a 76 percent increase in unfilled positions from the previous two years.
And, adding to developers’ headaches, permitting and local regulations continue to stretch out project timelines and add cost. As a result of all these factors, according to the Harvard researchers, in 2018 the average project finished 14 months after it started, the slowest pace seen in nearly a half a century. Permitting alone stretches out construction: The report cites a 2019 Fannie Mae study that found the process can tack on 3 to 6 months in Dallas, 6 to 8 months in Chicago, and a year or more in San Francisco.
Affordability continues to be a challenge
Combine all these factors—more competition from high-income renters, a market designed around meeting their needs, and increasing costs associated with rental construction—and it’s no surprise the nation’s lower-income renters face more and more stress and economic strain.
As more expensive housing options get built across the country, the stock of affordable units continues to disappear. From 2000 to 2017, the percentage of rental units nationwide that cost $600 a month or less (in 2017 dollars) fell from 37.5 percent to 25 percent. That helps explain, the report notes, why there are now only 37 available affordable units for every 100 extremely low-income households—those who make 30 percent or less of the area median income—per the National Low-Income Housing Coalition.
The number of cost-burdened renters—those paying 30 percent or more of their income on rent—inched upward. In 2018, there were 6 million more cost-burdened renters in the U.S. than there were in 2001. While the rent-burdened population decreased slightly each year between 2015 and 2017, 2018 saw an increase of 261,000 households.
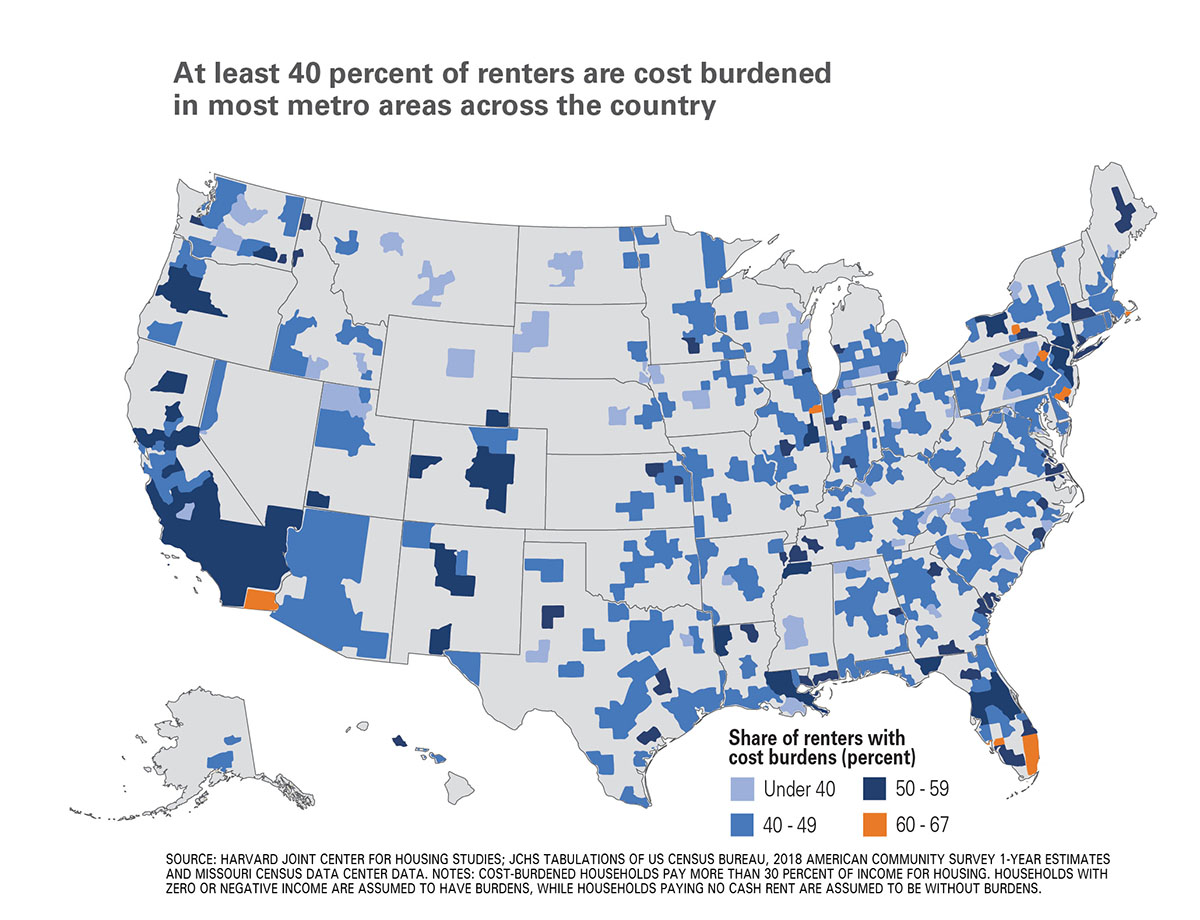
That means 20.8 million Americans are rent-burdened, with nearly half of them, 10.9 million, qualifying as severely rent-burdened, defined as paying half their income for housing. In 46 states, more than two in five renters are considered rent-burdened.
The report’s authors also found middle-income renters feeling more pressure. For households making $30,000 to $44,999 a year, the share of cost-burdened renters went up 5.4 percentage points, and those making $45,000 to $74,999 saw a 4.3 percentage-point increase. Harvard researchers found that the growth in these middle-income renters feeling cost burdens was most apparent in bigger, more expensive metro areas. “It is increasingly difficult for households with modest incomes to find housing that is within their means,” they concluded.
While cities do have a slightly higher percentage of cost-burdened renters than other parts of the country, the issue isn’t confined to areas with high costs of living.
Los Angeles renters, who make a median income of $52,000, pay a median rent of $1,560 a month, with 56 percent considered cost-burdened. New Orleans, with a median rent of just $960, might seem like a more affordable place to live. But since the median income was $30,000, as the report notes, it actually has the exact same percentage of cost-burdened renters as Los Angeles.
The federal government isn’t meeting the affordability challenge
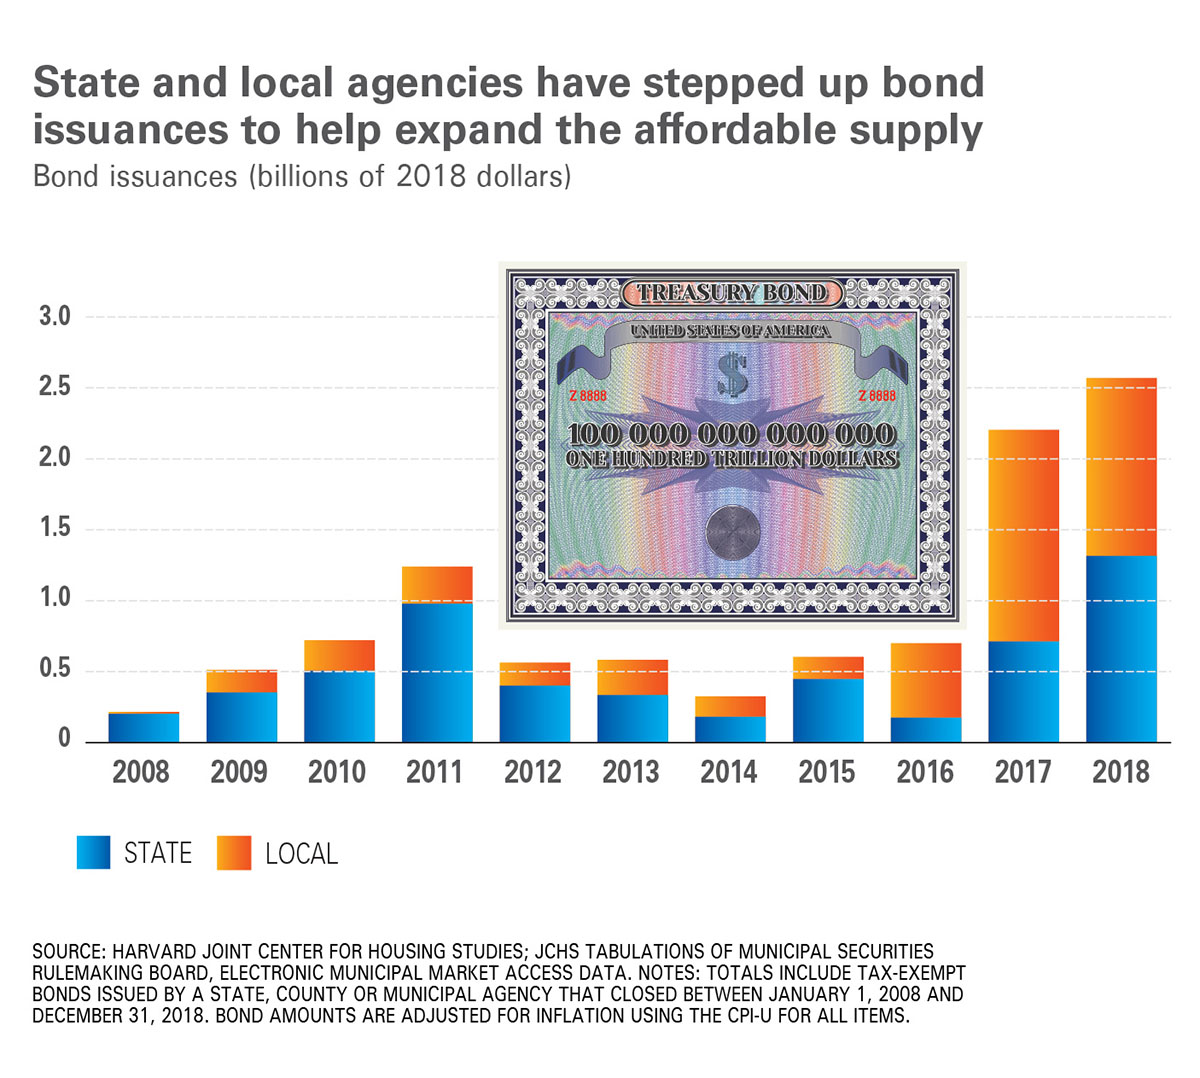
In an election year filled with increased political activism and awareness around housing policy, the report’s evaluation of the state of housing assistance seems particularly noteworthy. While there’s more activity at the state and local level, especially around reforms such as upzoning and increasing funding for affordable housing, the federal response has been muted at best.
The Harvard report notes that the Department of Housing and Development (HUD), the primary source of rental assistance and public housing support in the nation, has slightly increased its budget between 2014 and 2018, from $37.8 million to $40.3 billion, since the per-household cost of rental assistance also increased, the number of households being helped actually fell by 0.4 percent. Currently, HUD rental assistance programs reach only about one in every four of the nation’s 4.6 million eligible households.
In addition, JCHS research found that 935,000 subsidized rentals will have their federal affordability restrictions expire by 2030. With investment in assistance failing to keep up with demand, and the specter of the supply of low-cost rental units shrinking, the affordability issue seems likely to continue to get worse without additional interventions.
Source Patrick Sisson, Curbed


