

CoStar recently released its quarterly report on the change in value of commercial property in the United States. This article looks at the part of the report that deals with multifamily property values.
Defining the indices
The CoStar report focuses on a relative measure of property values called the CoStar Commercial Repeat Sales Index (CCRSI). This index is computed based on the resale of properties whose earlier sales prices and sales dates are known. The index represents the relative change in the price of property over time rather than its absolute worth.
By focusing on repeat sales rather than all sales, the index compensates for the effects of potentially comparing the sales of properties with different characteristics in different time periods. However, by only using repeat sales, the number of transactions that can be used to calculate the index in any time period is reduced. In June 2020, there were 669 sales pairs for all of the property types tracked by CoStar. This is down from a level of 1,448 sales pairs in June 2019. Dollar volume dropped from $15.8 billion in June 2019 to only $4.1 billion in June 2020. These figures show how the uncertainty due to COVID-19 has cooled the market.
Comparing commercial property types
The first chart shows how multifamily property values have changed over time relative to the values of other primary commercial property types CoStar tracks. The data is normalized so that the index values for all property types are set to be 100 in December 2000. The change in the value of the index since then shows how the relative value of that property type has changed.

The chart shows that multifamily property values have risen faster than those of office, industrial or retail property, particularly since the recovery from the recent downturn began around 2010. However, in the last 12 months, multifamily property values have risen by only 3.3 percent based on the equal weighted index. This trails both the index for industrial property, which saw a rise of 6.1 percent, and the index for land, which saw a rise of 10.0 percent.
Comparing regions
The next chart shows how the CoStar multifamily price indices for the four Census regions of the United States have changed since 2000. As before, each of the indices is normalized to a value of 100 in December 2000, and the chart shows the relative change in value since then. Having a higher index value does not necessarily mean that the value of the property in dollars per door or dollars per square foot is higher.
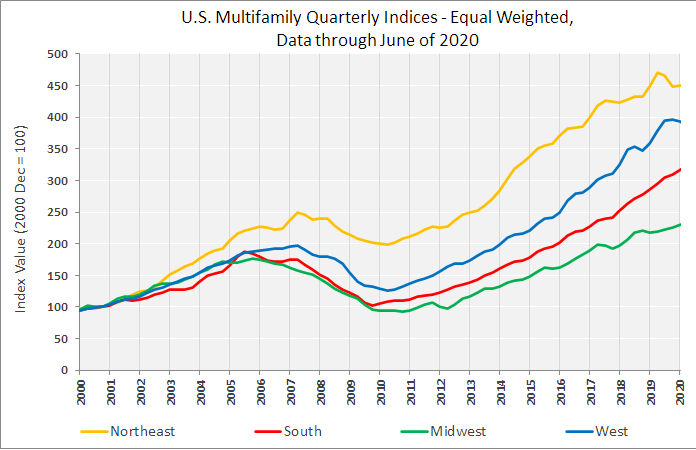
The chart shows that the Northeast has been the region with the strongest appreciation in multifamily property values since December 2000, with prices rising by 354 percent since then. The West was next in line with a rise of 284 percent followed by the South with a rise of 223 percent. The Midwest has had the lowest property value appreciation with prices rising by only 130 percent.
Using CoStar’s equal weighted indices and comparing to year-earlier levels, prices were up by 9.3 percent in the South, 5.3 percent in the Midwest and 1.2 percent in the West. Prices fell by 3.7 percent in the Northeast.
According to the report, multifamily property values were softest at the high end of the market, in what CoStar calls prime multifamily metros. For the quarter, prices in this sub-market fell by 2.6 percent compared with a 0.6 percent fall in the overall multifamily property market. For the year, prices in the prime multifamily metros fell by 0.3 percent compared with a 3.3 percent rise in property values for the multifamily property market as a whole.
The full report can be found here.


