

Recent reports from CoStar and from Real Capital Analytics (RCA) show that multifamily property prices continued to increase in October.
Defining the indices
The CoStar report focuses on a relative measure of property values called the CoStar Commercial Repeat Sales Index (CCRSI). Real Capital Analytics calls their equivalent measure the Commercial Property Price Index (CPPI). Both indices are computed based on the resale of properties whose earlier sales prices and sales dates are known. The indices represent the relative change in the price of property over time rather than its absolute price.
Multifamily property prices hold up
RCA reported that the CPPI for apartments in October was 7.2 percent higher than its levels one year ago. This compares to only a 3.6 percent annual increase for all commercial property types and an 8.5 percent rise in the index for industrial properties. RCA found that prices for properties in the retail sector in October were 5.2 percent lower than their levels of a year ago while office prices were down 1 percent in that time.
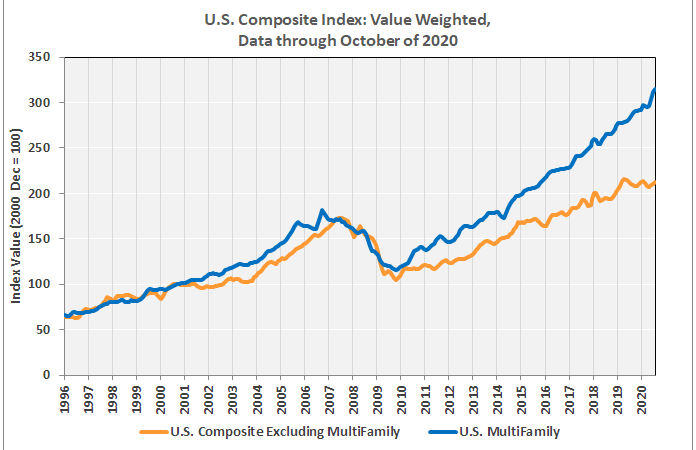
CoStar reported that its value-weighted index of multifamily property prices increased 1.3 percent in October from its level in September. The index was 10.6 percent higher than its level in October 2019. By comparison, the value-weighted index for all commercial property types, excluding multifamily, was up 1.4 percent for the month and up only 1.2 percent higher than its year-earlier level.
The history of the value-weighted CCRSIs for commercial properties, excluding multifamily, and for multifamily as an asset class are shown in the chart, below.
Transaction volume down
While they did not break out transaction volume by commercial property type, CoStar included information on overall commercial property sales transactions on properties for which they have purchase information. CoStar found that the volume of transaction-pairs in the first 10 months of 2020 was 39.5 percent lower than for the same period of 2019.
CoStar studies other transaction statistics to discern trends in market liquidity. The greatest statistical change between transactions in October 2020 and those occurring a year ago is that the number of days on market grew from 197 in 2019 to 207 in 2020. This implies reduced liquidity. Compared to year-ago levels, the sales price to asking price ratio fell from 92.5 percent to 92.4 percent and the withdrawal rate for discouraged sellers rose from 27.1 percent to 27.5 percent, also implying reduce liquidity.
The full CoStar report can be found here. The RCA report can be found here.


