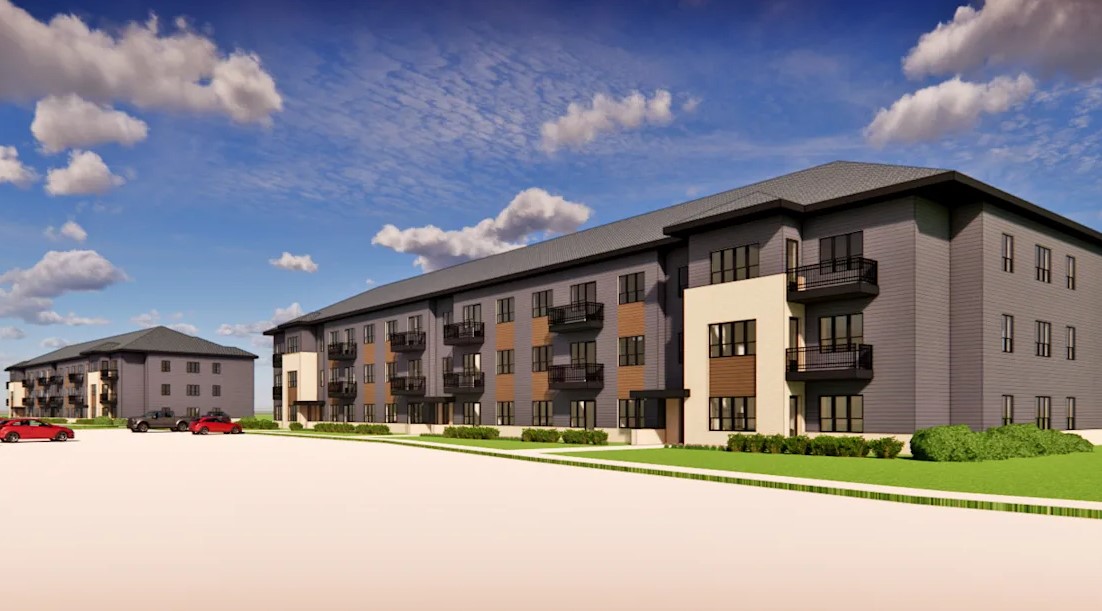
The latest rent report from Yardi Matrix shows record growth in multifamily asking rents for the country as-a-whole in August, with SFR rent growth outpacing that of multifamily.
Rents up sharply again
Yardi Matrix reported that the national average apartment rent rose $25 in August to $1,539 per month. The national average rent was up 10.3 percent from its year-earlier level. However, last August was a particularly weak period for rents in many regions which may be making the year-over-year comparison appear stronger than it actually is. Occupancy of multifamily rentals was up 1.1 percent year-over-year.
The rent figures being tracked by Yardi Matrix are asking rents for vacant units. Rent growth for lease renewals is lower.
Yardi Matrix reported that SFR rents were up 13.9 percent year-over-year, driven by high demand. Occupancy of single-family rentals was up 1.1 percent year-over-year.
Rent growth (almost) everywhere
Of the top 30 metros, the ones with the lowest annual apartment rent increases as ranked by Yardi Matrix are given in the table, below, along with their annual percentage rent changes. This report marks the first time since the pandemic began that all of the top 30 metros had positive year-over-year rent growth. However, in both San Francisco and New York City, rents are still below pre-pandemic levels. In addition, there were two smaller metros, Queens and Midland-Odessa, that still saw year-over-year rent declines.
| Metro | YoY rent change % |
| San Francisco | 1.4 |
| New York | 2.8 |
| Twin Cities | 3.0 |
| San Jose | 3.4 |
| Kansas City | 5.6 |
| Washington DC | 6.2 |
| Los Angeles | 7.0 |
| Houston | 7.5 |
| Chicago | 8.0 |
| Indianapolis | 8.3 |
Eight of the metros listed in the table above experienced a loss of jobs year-over-year, based on 6-month moving averages. Six of the metros saw completions over the past 12 months exceed 2 percent of existing housing stock.
The major metros with the largest year-over-year apartment rent growth as determined by Yardi Matrix are listed in the next table, below, along with the year-over-year rent increases for the metros.
| Metro | YoY rent change % |
| Phoenix | 22.0 |
| Tampa | 20.2 |
| Las Vegas | 19.2 |
| Inland Empire | 17.5 |
| Miami Metro | 17.5 |
| Raleigh | 17.0 |
| Atlanta | 16.7 |
| Charlotte | 15.4 |
| Austin | 14.9 |
| Sacramento | 13.9 |
None of the metros listed in the second table lost jobs based on 6-month moving averages. However, 7 of the 10 saw new unit completions over the past 12 months of 2 percent of existing stock or higher, with Charlotte and Austin seeing completions of over 4 percent of existing stock.
Source of growth
Yardi Matrix postulated that rents are being driven by an increase in the number of households. People who moved in with others during the shutdown of the economy are now moving back out on their own as jobs are readily available. In addition, savings accumulated during the forced inactivity over the past 18 months allow people to afford higher rents.
A consequence of these conditions is that rents and occupancy in higher-end “lifestyle” properties are outpacing those in “renter-by-necessity” properties. This reverses a pattern that has been in place for the last several years.
SFR outperforms
Yardi Matrix reported on the top 30 metros for single family rentals. The leading metros for year-over-year rent growth were Tampa (38.4 percent) and Miami (26.7 percent). All 30 of the metros covered saw positive rent growth for the year.
Only 6 of the top 30 metros experienced year-over-year occupancy declines. They were Atlanta, Orlando, Sacramento, Philadelphia, Cleveland and Inland Empire.
The complete Yardi Matrix report discusses some of the smaller multifamily housing markets. It has more information about the larger multifamily markets including numbers on job growth and completions of new units. It also includes charts showing the history of rent changes in 18 of the top 30 markets over the last 4 years. It can be found here.


