

The Census Bureau’s report on residential construction spending shows that the value of residential construction put in place in August was up 24 percent year-over-year but up only 0.4 percent month-over-month.
Improvements lead growth
The reported value of total private residential construction put in place in August 2021 came in at $787 billion on a seasonally adjusted, annualized basis. This figure, which includes spending on both new construction and on improvements, was up $3.1 billion from July’s revised figure. However, the preliminary figure reported for July was revised upward by $10.6 billion, so the preliminary figure for August is actually $13.7 billion higher than the preliminary figure for July reported last month.
The value of new construction of multifamily residential buildings put in place in August was reported to be $99.5 billion on a seasonally adjusted, annualized basis. This was reported to be down $802 million from the revised level for July, but only because the preliminary figure for July was revised upward by $1.5 billion this month. The value of multifamily housing construction put in place in August 2021 was 12.7 percent higher than the level of August 2020.
The value of new single-family residential construction put in place in August was $413.4 billion on a seasonally adjusted, annualized basis. This was down 0.7 percent from the revised level for July and was up 38 percent from the of August 2020.
The value of improvements to residential buildings put in place in August was reported to be $273.7 billion on a seasonally adjusted, annualized basis. This was up 2.5 percent from the revised level for July and was up 11.4 percent from the year-earlier level. The Census Bureau does not separate out improvements for single-family and multifamily residential buildings.
Charting the data
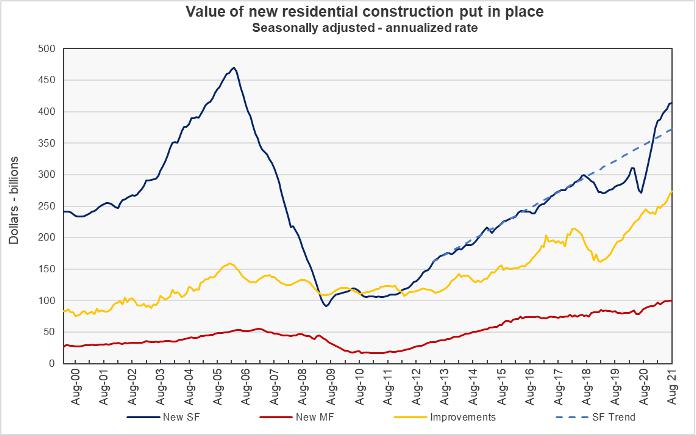
The first chart, below, shows the history of new residential construction spending since January 2000 for single-family housing, multifamily housing and residential improvements. It also shows a trendline for single-family construction based on the steady growth in the value of construction put in place between 2013 and 2018. This chart is included for perspective on where the housing construction has been and on how the current boom in residential construction compares with the housing bubble of 2005-2006.
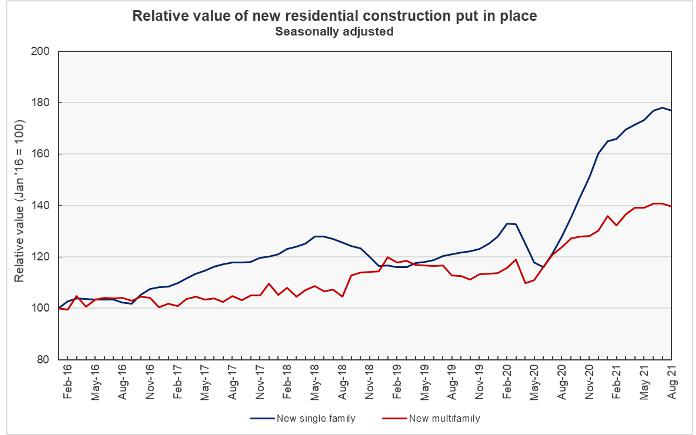
The final chart focuses on the period since January 2016. In this chart, the value of the construction put in place for the two categories of new residential construction are normalized so that the readings for January 2016 equal 100. This chart allows recent trends to be more easily seen. It shows that the value of both single-family and multifamily housing put in place may have reached plateaus in recent months.
The Census report on unit completions also indicates that multifamily completions have been flat or trending downward since April 2021. However, the rising number of multifamily unit starts points to higher completion numbers in the months ahead.
The report from the Census Bureau also includes information on spending on other types of construction projects. The full report can be found here.


