

A report from the Mortgage Bankers’ Association (MBA) says that there was a significant rise in the originations of multifamily mortgages in Q3 both on a quarter-over-quarter and on a year-over-year basis.
Tracking multifamily mortgage originations
The first chart, below, shows the quarterly origination volume indices since Q1 2018 for both commercial mortgages and for multifamily mortgages as reported by the MBA. The indices are reported relative to the year 2001, with the average quarterly volume in that year defined as a value of 100.

The data show a clear pattern of seasonality with the volume of originations rising during each subsequent quarter of the year only to drop back down in the first quarter of the next year. In addition, the origination volume of a given quarter of a year is higher than that of the same quarter of the year before. Between 2017 and 2019, this year-over-year growth averaged about 16 percent for multifamily mortgages.
The multifamily mortgage origination index for Q3 2021 was 829. This was up 31 percent from the level in Q2 and was up 106 percent from the pandemic-impacted level of 2020. Compared to Q3 2019, the index was up 42 percent. This compares to a 34 percent rise that would have been expected if originations had grown by the 16 percent yearly average, so it was a good performance.
The MBA originations index for commercial properties as-a-whole was up 120 percent percent in Q3 2021 compared to Q3 2020. However, it was only 17 percent higher than its reading in Q3 2019. The growth in mortgage originations for commercial property as a single asset class is much less steady than the growth in multifamily mortgage originations so the actual performance is more likely to deviate from any projected result. However, the average rate of growth in commercial mortgage originations between 2016 and 2019 would have predicted an increase in originations of 22 percent between 2019 and 2021.
The weakest sector for commercial mortgage originations was healthcare where originations were down 52 percent from Q2, although they were up 45 percent from Q3 2020.
The big guys step up
The MBA report also includes data on the sources of the mortgages being originated. It provides data on five categories of lenders: commercial mortgage-backed securities (CMBS) and conduits, commercial banks, life insurance companies, the government sponsored entities (GSEs), Fannie Mae and Freddie Mac, and investor-driven lenders such as REITs and specialty finance companies. The relative rate of originations for each of these categories of lender is shown in the next chart.
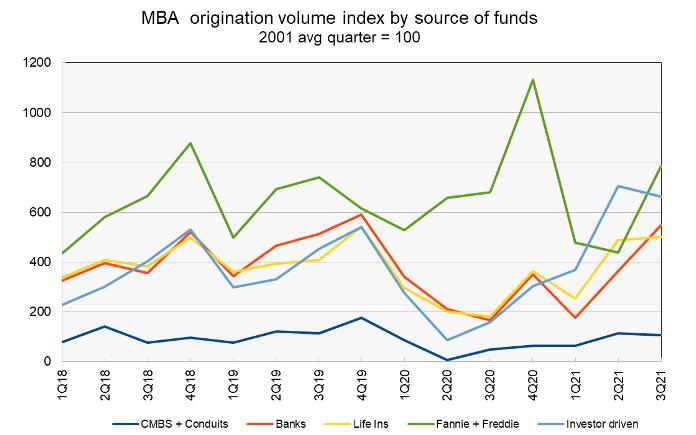
As before, the index values are quoted relative to the average quarterly origination volumes in the year 2001. The index values of different originators cannot be used to compare their absolute levels of mortgage originations since their origination levels in the baseline year of 2001 were different. However, the index values can be compared to see which originators are growing their businesses and which are not.
Readers of the report on the dollar value of commercial mortgage debt outstanding know that the GSEs and commercial banks are the largest providers of mortgage funds. In Q3, the GSE’s increased their originations by 79 percent compared to Q2 while commercial banks increased their originations by 51 percent. The other providers either had small gains or small losses in their levels of originations.
The full report from the MBA includes additional information on lending for other commercial property types. It can be found here.


