

The Bureau of Labor Statistics (BLS) released its producer price index report for November 2021. It showed that construction components and materials prices were up 1.6 percent in the month, seasonally adjusted. The index was 21.0 percent higher than its year-earlier level.
Overall prices for processed goods for intermediate demand rose by 1.5 percent in the month. The index was 26.5 percent higher than its year-ago level.
For reference, the changes in these indices compare with a 6.8 percent rise in the all-items consumer price index (CPI-U) for the 12 months ending in November. The CPI-U was up 0.8 percent for the month. The shelter portion of the CPI was up 3.8 percent from the year-ago level.
Yield Pro compiled the BLS reported price changes for our standard list of construction commodities. These are commodities whose prices directly impact the cost of constructing an apartment building. The two right hand columns of the table provide the percent change in the price of the commodity from a year earlier (12 Mo PC Change) and the percent change in price from October 2021 (1 Mo PC Change). If no price data is available for a given commodity, the change is listed as N/A.
The pre-COVID column lists the change in the current commodity prices relative to the average prices in December 2019 through February 2020, before the pandemic impacted the economy. This may give a truer idea of the magnitude of the recent price increases than does the 12 Mo PC Change column for commodities, such as lumber, whose prices were already rising sharply last summer.
| Commodity | 12 Mo PC Change | 1 Mo PC Change | Pre-COVID Change |
| Softwood lumber | 3.6 | 6.0 | 38.8 |
| Hardwood lumber | 36.9 | -0.4 | 48.3 |
| General millworks | 13.2 | 0.5 | 15.6 |
| Soft plywood products | 2.0 | 4.5 | 67.7 |
| Hot rolled steel bars, plates and structural shapes | 60.6 | 2.7 | 60.7 |
| Copper wire and cable | 28.1 | 1.0 | 35.4 |
| Power wire and cable | 37.7 | 3.2 | 48.0 |
| Builder’s hardware | 18.0 | 2.3 | 18.4 |
| Plumbing fixtures and fittings | 4.0 | 0.5 | 5.4 |
| Enameled iron and metal sanitary ware | 0.1 | 0.0 | 3.5 |
| Furnaces and heaters | 12.4 | 0.5 | 12.8 |
| Sheet metal products | 33.9 | 2.9 | 33.4 |
| Electrical Lighting fixtures | 14.1 | 0.3 | 10.4 |
| Nails | 30.7 | 0.5 | 31.5 |
| Major appliances | 5.5 | 0.2 | 8.8 |
| Flat glass | 12.1 | 1.2 | 12.2 |
| Ready mix concrete | 7.4 | 0.7 | 7.8 |
| Asphalt roofing and siding | 17.7 | 3.2 | 21.2 |
| Gypsum products | 20.2 | 0.0 | 22.8 |
| Mineral wool insulation | 19.6 | -0.5 | 21.9 |
The first chart, below, shows the price index history for wood products over the past 25 months. Note that the prices used by the BLS in compiling the indexes are collected on the Tuesday of the week containing the 13th day of the month. In November 2021 that would have been November 9.
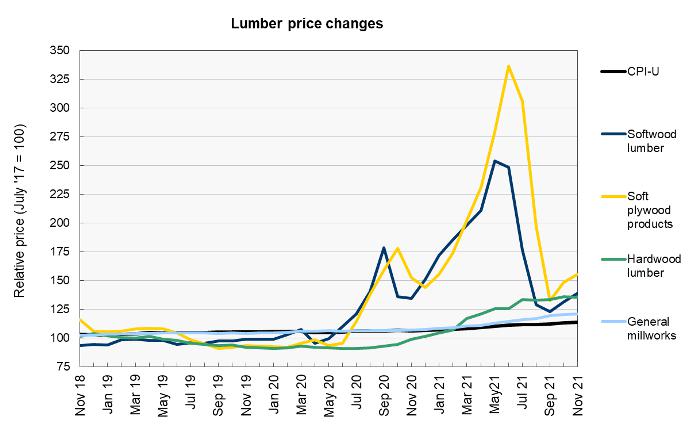
In November, the price of softwood lumber saw the largest monthly percentage increase of the commodities we track, rising 6 percent. However, the softwood lumber price remains well below the highs it reached last summer. Recently, the market price of lumber has been surging higher again, closing at above $1,110 on December 14. Lumber prices hit a recent low of $536 in mid-November and had been trading at around $400 in January 2020, before the pandemic.
Lumber prices in the futures markets have been moving up in line with the rise in the spot price. The July 2022 contract, which had been trading at around $700 in mid-November, was at $965 in mid-December. The September 2022 contract was at $905.
The price of soft plywood products has now seen the largest percentage rise compared to its pre-pandemic level of the commodities we track, rising nearly 68 percent. It was up significantly in November, rising 4.5 percent month-over-month.
The prices of hardwood lumber and of general millworks have not seen the steep climbs and drops of softwood lumber and plywood, but they have recently been moving steadily higher. Hardwood lumber has now seen a higher percentage price rise compared to its pre-pandemic level than has softwood lumber.
The next chart, below, shows the recent history of several other construction materials prices. The price rises for hot-rolled steel products are contending with those of plywood for the highest percentage increase relative to their levels immediately before the pandemic. The prices of other metals-based commodities we track, like sheet metal products, nails, power wire and copper wire are also all up more than 30 percent from their pre-pandemic levels.
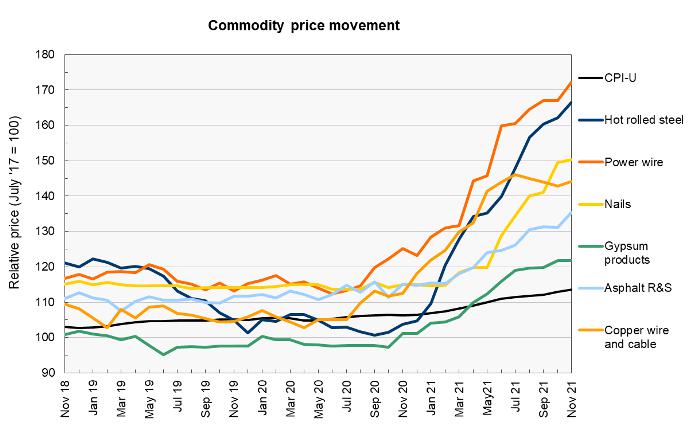
MarketWatch reports that the NYSE American steel index has been trading in a fairly narrow range of between $1,500 and $1,600 since mid-September. It closed on December 14 at $1,547. If this stability can be maintained, one driver of price increases for the heavily steel-based commodities will be removed. Steel futures are indicating that lower prices may be coming next year. The April 2022 contract is now priced at $1,213, down from $1,305 last month. The July 2022 contract is now at $1,067.
The price of copper is down from its recent high of $4.73 in mid-October and has been trading between $4.25 and $4.47 over the last 6 weeks.
The price of aluminum is also down from the recent high of $3,168 it reached in mid-October. It has recently traded around $2,650. While this is down from the recent high, it is up significantly from the $1,800 it was trading for at the start of 2020.
The prices of asphalt roofing and siding and of gypsum products have each risen more than 20 percent from their pre-pandemic levels. It is a testament to the size of the price increases of the other commodities in the chart that price rises of only 20 percent are hardly worth discussing.
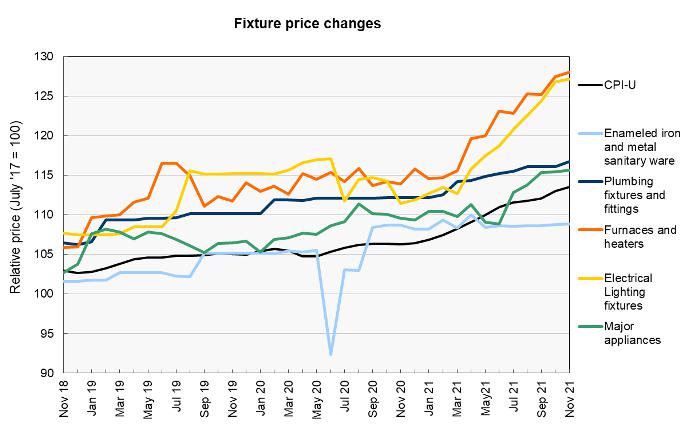
Price changes for several of the more finished goods from our sample are illustrated in the final chart, below. Electrical lighting fixtures and furnaces and heaters have been moving steadily higher recently. The price rises for plumbing fixtures and fittings and for enameled iron and metal sanitary ware have been among the smallest of the construction materials prices we track.
The full BLS report can be found here.


