

The latest rent report from Apartment List shows that the national average rent fell slightly in December, the only month-over-month rent decline in 2021. Nationally, rents fell 0.2 percent for the month while they were up 17.8 percent year-over-year.
Rent growth and vacancy rates tell a story
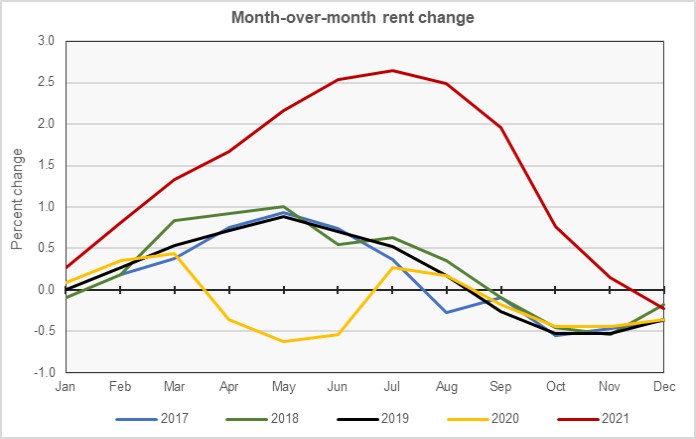
Apartment List has been collecting rent data since January 2017. In that time, rents fell month-over-month in the last four months of the year every year except for 2021. Also in that time, rents rose month-over-month in April through June every year except for 2020. The first chart, below, shows the history of month-over-month rent growth from the Apartment List data set.
The Apartment List report cited vacancy data as an explanation for the unusual changes in rent growth rates since the pandemic started in early 2020. This data is illustrated in the next chart, below, which is reproduced from the Apartment List report.
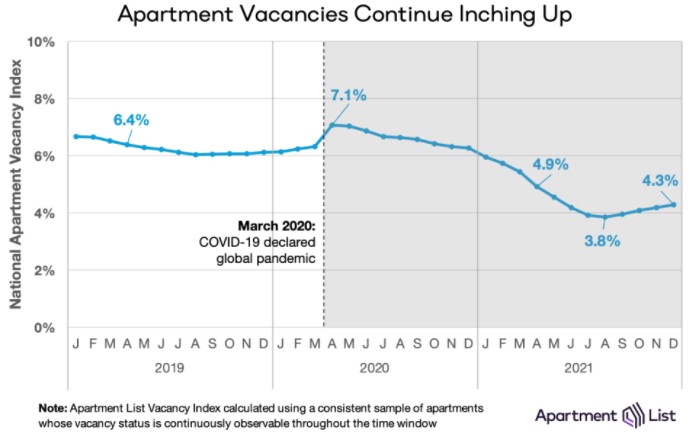
The chart shows that the national vacancy rate was a little over 6 percent just prior to the pandemic-related lockdowns of the economy. It jumped nearly one percent in a month, peaking at 7.1 percent in April 2020. This corresponds to the period in the first chart where monthly rent growth turned negative in the spring of 2020, an unusual event for that time of year.
In early 2021, the national vacancy rate dropped below its pre-pandemic level. This corresponds to the period when the rent growth surge of 2021 began. Month-over-month rent growth hit its peak in the July-August time frame, just as the vacancy rate was bottoming out. The rise in vacancies in recent months corresponds to a period where the rate of month-over-month rent growth was falling.
As 2021 ended, the vacancy rate remained low and rents remained high. In December, month-over-month rent growth turned negative despite the vacancy rate remaining well below pre-pandemic levels.
Leaders and trailers
Apartment List provides the underlying data they collected in compiling their report and that data was used to create the tables, below. The tables look at the 50 largest metropolitan statistical areas by population as defined by the US Census Bureau and identify the top and bottom 10 metros for year-over-year rent growth. The tables provide the average monthly rent in the metro, the annual percentage change in rent (YoY Metro) along with the percentage change from the prior month’s rent level (MoM Metro). They also list the percentage change in rent for the metro area compared to the rent level in February 2020, right before the pandemic struck (Feb 20).
The first table shows the 10 metros with the smallest annual rent increases. Only two of these metros saw their rents rise month-over-month in December. Overall, 38 of the 50 largest metros saw rents decline or remain unchanged month-over-month in December.
Of the metros listed in the first table, only San Francisco has rents that are still below their pre-pandemic levels. Of the other largest metros, only San Jose, Calif. also has rents that are still below their pre-pandemic levels. Rents there are down by 6.6 percent.
| Metro | Metro Rent | YoY Metro | MoM Metro | Feb 20 |
| Minneapolis | $1,282 | 6.1 | -0.7 | 0.5 |
| Louisville | $999 | 8.2 | -0.3 | 8.9 |
| Cleveland | $981 | 9.7 | 0.0 | 13.2 |
| Kansas City | $1,170 | 9.8 | -0.3 | 10.3 |
| San Francisco | $2,212 | 10.1 | -1.0 | -6.6 |
| Milwaukee | $1,078 | 10.1 | 0.0 | 11.3 |
| Detroit | $1,158 | 10.2 | -0.3 | 15.3 |
| St Louis | $1,107 | 10.4 | 0.1 | 11.5 |
| Birmingham | $1,153 | 11.0 | 0.1 | 13.7 |
| Harford | $1,493 | 11.3 | -1.3 | 14.7 |
The metros in the top 50 by population with the largest year-over-year rent increases are listed in the next table, below. Not only are rents up significantly over the last 12 months in these metros, they are also up significantly since February 2020. However, only four of the metros listed in this table experienced positive rent growth for the month of December.
| Metro | Metro Rent | YoY Metro | MoM Metro | Feb 20 |
| Tampa | $1,715 | 32.4 | -0.7 | 36.2 |
| Miami | $1,979 | 30.7 | 0.7 | 28.8 |
| Phoenix | $1,726 | 28.9 | 0.1 | 33.3 |
| Orlando | $1,690 | 28.1 | 0.1 | 23.3 |
| Jacksonville | $1,535 | 27.2 | -0.2 | 31.3 |
| Las Vegas | $1,647 | 26.9 | -0.7 | 33.1 |
| Austin | $1,677 | 24.8 | -0.3 | 20.0 |
| Atlanta | $1,565 | 23.4 | -0.3 | 26.4 |
| Salt Lake City | $1,525 | 21.6 | 0.5 | 22.7 |
| Nashville | $1,492 | 21.3 | 0.0 | 19.1 |
The complete Apartment List report covers many more metros and contains some interesting charts illustrating how rents have changed over time in the hardest hit markets. It also provides readers with the opportunity to download their data sets. It can be found here.


