

The Census Bureau’s new residential construction report for April showed continued high levels of multifamily housing construction permit issuance and unit starts, but unit completions declined, resulting in another increase in the number of units under construction.
Note that the Census Bureau periodically reviews how they apply seasonal adjustment factors to their data. With this month’s report, Census has revised all of the seasonally adjusted results they have reported since January 2017. Therefore, the past results included in this report may differ from those appearing in our previous reports.
Multifamily housing permits soften slightly
The number of permits issued for buildings with 5 or more units in April was reported to be 656,000 units on a seasonally adjusted, annualized basis. This was down 1 percent (4,000 units) from March’s revised (-12,000 units) figure. April permits were up 16 percent from the level recorded in April 2021 and were 12 percent higher than the trailing 12-month average.
In addition, 53,000 permits were issued in April for units in buildings with 2 to 4 units. This was down 3,000 units from the revised (+2,000 units) level for March. April permits for units in buildings with 2 to 4 units were up 8 percent from the year-ago level but were fractionally lower than the trailing 12-month average.
Regional data for multifamily housing is only reported for structures with two or more units. “Structures with 5 or more units” is not broken out as a separate category. Since the regional data is highly volatile and is frequently revised, it is examined here based on three-month moving averages. This averaging will tend to smooth out the month-to-month variations in the data.
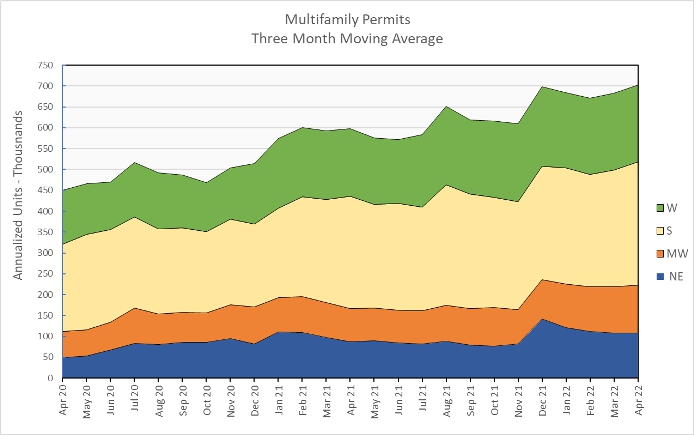
Nationally, the three-month weighted moving average for permits issued for multifamily housing in April was up 3 percent from the level in March and was 17 percent higher than the level of April 2021. Permit issuance history is shown in the first chart, below. The three-month weighted moving average for permits came it at 702,000 units.
On a month over month basis, the three-month weighted moving average for multifamily permit issuance was up 6 percent in the South and 3 percent in the Midwest. Multifamily permit issuance was unchanged in the Northeast and down 1 percent in the West.
When compared to year-earlier levels, the three-month weighted moving average of permits issued was up 45 percent in the Midwest, 23 percent in the Northeast, 13 percent in the West and 10 percent in the South.
The following chart shows the three-month weighted moving averages of permits by region for the last 25 months.
Multifamily housing construction starts reach multi-decade high
The preliminary April figure for multifamily housing starts in buildings with 5 or more units was 612,000 units on a seasonally adjusted, annualized basis. This was reported to be up 17 percent (88,000 units) from the revised figure (-50,000 units) for March and was the highest number of starts reported since April 1986.
Compared to the level of April 2021, multifamily housing starts in buildings with 5 or more units were up 42 percent. The reported starts figure was 26 percent above the trailing 12-month average and 46 percent higher than the monthly average from 2019.
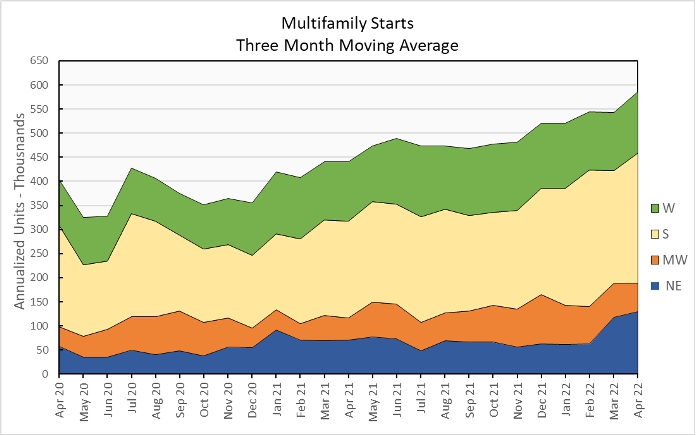
Multifamily housing construction starts (two or more units per building) in April were up 8 percent from their March level for the country as-a-whole, based on three-month weighted moving averages. Starts were up 16 percent in the South, 10 percent in the Northeast and 5 percent in the West. However, starts fell 17 percent in the Midwest from the level of the prior month.
The three-month weighted moving average of starts was up 33 percent for the country-as-a-whole on a year-over-year basis. Compared to April 2021, starts were up 82 percent in the Northeast, 34 percent in the South, 31 percent in the Midwest and 4 percent in the West.
The following chart shows the three-month weighted moving average of starts by region for the last 25 months.
Multifamily housing completions continue to lag
The preliminary April multifamily housing unit completions figure in buildings with 5 or more units per building was 281,000 units on a seasonally adjusted, annualized basis. This was reported to be down 7 percent (20,000) units from March’s revised (+9,000 units) figure.
Compared to April 2021, multifamily housing completions in buildings with 5 or more units per building were down 33 percent. Compared to the trailing 12-month average, completions were down 19 percent and compared to the monthly average for 2019, completions were down 19 percent.
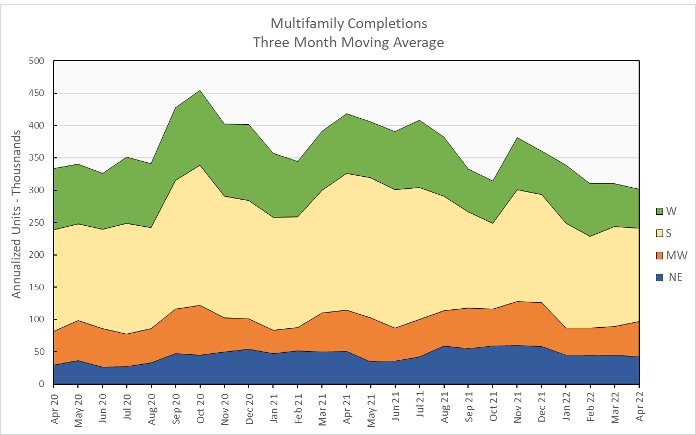
For the country as-a-whole, multifamily housing construction completions (two or more units per building) were down 3 percent month-over-month, comparing three-month weighted moving averages. The three-month weighted moving average of completions was up 23 percent in the Midwest but was down 6 percent in both the South and the Northeast, and 10 percent in the West.
On a year-over-year basis, the three-month weighted moving average of completions in buildings with 2 or more units per building was down 28 percent nationally. Completions were down in all regions, falling, 14 percent in the Midwest, 17 percent in the Northeast, 31 percent in the South and 35 percent in the West.
The three-month weighted moving average of completions by region for the past 25 months are shown in the chart below.
As the number of unit starts outpaces the number of unit completions, the number of units under construction continues to rise. In April, Census reported that there were 811,000 units under construction in buildings with 5 or more units per building on a seasonally adjusted annualized basis. This is up by 18,000 units for the month and is 23 percent, or 149,000 units, above the number of units under construction one year earlier. It is the highest level of multifamily units under construction since February 1974.
All data quoted are based on seasonally adjusted results and are subject to revision.


