

A report from the Mortgage Bankers’ Association (MBA) says that multifamily mortgages originations in Q1 were up sharply on a year-over-year basis.
Tracking multifamily mortgage originations
The first chart, below, shows the quarterly origination volume indices since Q1 2018 for both commercial mortgages and for multifamily mortgages as reported by the MBA. The indices are reported relative to the year 2001, with the average quarterly volume in that year defined as a value of 100.
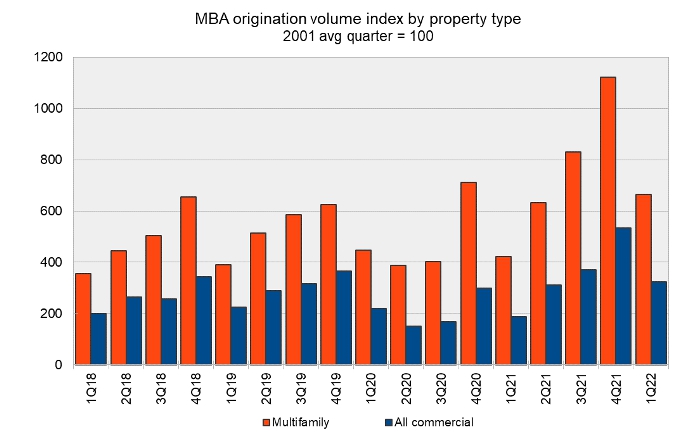
The data show a clear pattern of seasonality with the volume of multifamily mortgage originations rising during each subsequent quarter of the year only to drop back down in the first quarter of the next year. In addition, the origination volume of a given quarter of a year is generally higher than that of the same quarter of the year before. These patterns were broken in the pandemic year of 2020, but were restored in the recovery year of 2021.
The year 2022 is starting off following the pre-pandemic pattern. The multifamily mortgage origination index for Q1 2022 was 665. This was down 40 percent from its level in Q4 2021, a drop that is in line with those experienced in prior years. The origination index was up 57 percent from the level of Q1 2021, a higher than usual increase. However, this comparison benefits from a still-recovering level of originations in Q1 of last year.
The MBA originations index for commercial properties as-a-whole for Q1 2022 was 323. This was down 39 percent from its level in Q4 2021 but was up 72 percent compared to the level in Q1 2021.
Sources of funds
The MBA report also includes data on the sources of the commercial mortgages being originated. However, this section of the report does not break out multifamily lending from lending on other types of commercial real estate.
The report provides data on five categories of lenders: commercial mortgage-backed securities (CMBS) and conduits, commercial banks, life insurance companies, the government sponsored entities (GSEs), Fannie Mae and Freddie Mac, and investor-driven lenders such as REITs and specialty finance companies. As before, the index values are quoted relative to the average quarterly origination volumes in the year 2001. The index values of different originators cannot be used to compare their absolute levels of mortgage originations since their origination levels in the baseline year of 2001 were different. However, the index values can be compared to see which originators are growing their business and which are not.
In the next chart, below, the seasonality in the data is less clearly visible than in the first chart. However, the drop in originations for all types of lenders from Q4 2021 to Q1 2022 is apparent.
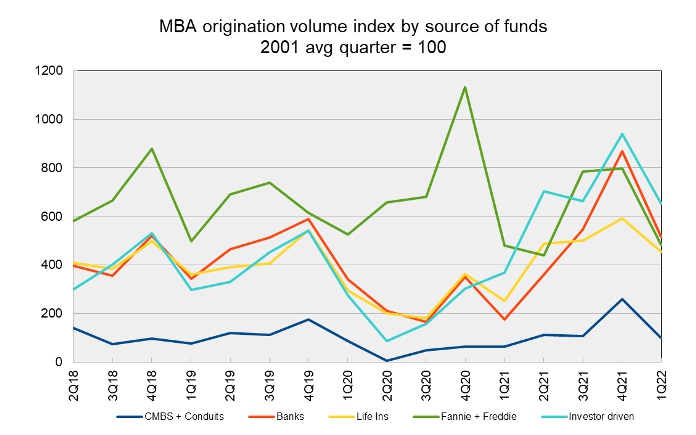
While overall originations were down by 39 percent from the previous quarter, the drop was only 23 percent for life insurers and 30 percent for investor-driven lenders. Howerver, commercial mortgage originations declined by 62 percent for CBMS and conduits.
Compared to year-earlier levels, originations were up by 194 percent for banks and 81 percent for life insurers. Originations were essentially flat from the GSE’s.
The full report from the MBA includes additional information on lending for other commercial property types. It can be found here.


