

In its inaugural report on apartment vacancy rates, Apartment List states that the national average rate rose to 4.95 percent in May. This is up 0.6 percent from the year-earlier value and up 0.9 percent from the low it reached last October. However, the apartment vacancy rate is down 1.7 percent from the rate in February 2020, before the effects of the pandemic were felt.
Vacancies drive rents
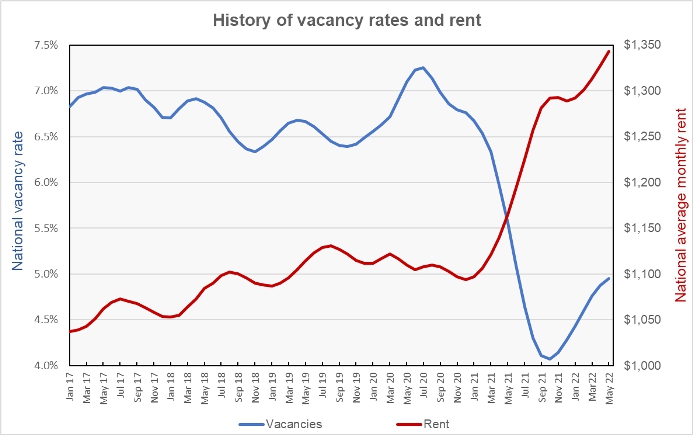
The first chart, below, shows the history of apartment vacancy rates plotted along with the national average apartment rent. It shows that the annual pattern of rents rising in the spring was interrupted in 2020 when the vacancy rate rose at the start of the pandemic. Rents surged when the vacancy rate fell in 2021 in response to businesses reopening and stimulus money flooding the economy.
Seeking patterns
The next chart, below, shows the change in the national average apartment vacancy rate compared to the rate in January of the year. This chart should reveal seasonality in the data, if it exists.
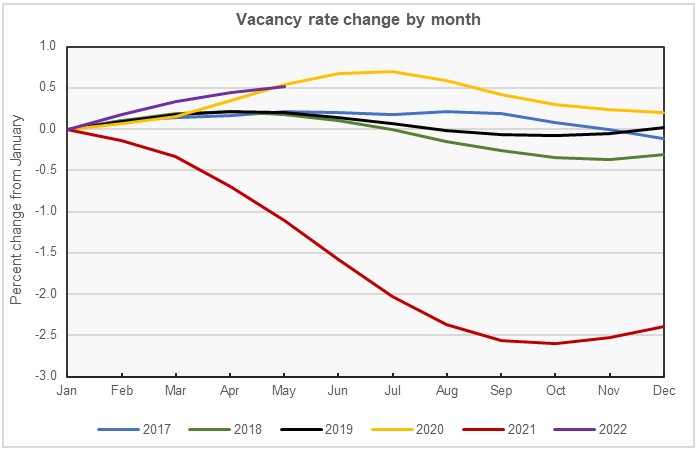
The chart does show a seasonal pattern where the vacancy rate rises in the spring and declines in the fall. This is counterintuitive since it indicates that apartment vacancy rates tend to rise at the time of year when rents are also rising and tends to decline at the time of year when rents are falling. Generally, rising rents would be expected to be driven by declining vacancies.
The expected pattern does appear in 2020 when the larger than usual rise in the apartment vacancy rate in the summer months is associated with a drop in rents. The expected pattern also appears in 2021, when the larger than usual decline in the apartment vacancy rate is associated with a rapid rise in rents.
Highs and lows
Apartment List provides the underlying data they collected in compiling their report and that data was used to create the tables, below. The tables look at the 52 metropolitan statistical areas defined by the US Census Bureau with populations over 1 million and identifies the metros with the top 10 and bottom 10 apartment vacancy rates. The tables provide the current vacancy rate in the metro (Vacancy), the vacancy rate one year ago (Year ago) and the vacancy rate in in February 2020, right before the pandemic struck (Feb 20).
The first table shows the 10 metros with the lowest apartment vacancy rates in May.
| Metro | Vacancy | Year ago | Feb 20 |
| Hartford | 2.9 | 4.3 | 6.8 |
| Cincinnati | 3.0 | 4.2 | 4.8 |
| Riverside | 3.0 | 1.9 | 5.7 |
| San Diego | 3.1 | 3.4 | 5.6 |
| Milwaukee | 3.2 | 4.9 | 6.3 |
| New York | 3.2 | 5.0 | 4.2 |
| New Orleans | 3.3 | 6.5 | 6.4 |
| Providence | 3.7 | 3.1 | 5.3 |
| Philadelphia | 3.8 | 5.2 | 5.2 |
| Grand Rapids | 3.8 | 2.8 | 6.5 |
The next table shows the 10 metros with the highest current apartment vacancy rates.
| Metro | Vacancy | Year ago | Feb 20 |
| Pittsburgh | 8.4 | 7.2 | 4.2 |
| San Antonio | 6.2 | 7.1 | 9.6 |
| Minneapolis | 6.2 | 7.7 | 6.0 |
| Houston | 6.1 | 7.3 | 5.0 |
| Tucson | 5.9 | 3.8 | 6.8 |
| Jacksonville | 5.8 | 4.5 | 7.2 |
| Austin | 5.8 | 6.2 | 8.0 |
| Dallas | 5.7 | 6.7 | 9.7 |
| Louisville | 5.7 | 7.3 | 8.5 |
| Charlotte | 5.6 | 5.9 | 7.3 |
The complete Apartment List report covers many more metros. It also provides readers with the opportunity to download their data sets. It can be found here.
The data described here is derived from the apartment properties with listings on the Apartment List website.


