

The latest commercial property price report from MSCI Real Capital Analytics said that multifamily property prices fell 0.6 percent in October from their level of the month before. Prices were still up 11.3 percent year-over-year. The year-over-year growth rate for multifamily property prices is down from that initially posted last month, marking the 8th month in a row of declining year-over-year price growth.
Defining CPPI
MSCI tracks an index called the Commercial Property Price Index (CPPI). The index is computed based on the resale prices of properties whose earlier sales prices and sales dates are known. The index represents the relative change in the price of property over time rather than its absolute price. Note that, as properties are added to the MSCI dataset each month, they recalculate the CPPI all the way back to the beginning of the data series.
Property prices fall
Price appreciation in October for all commercial property as a single asset class was 7.3 percent year-over-year. This is the first time that year-over-year price growth has been in single digits since April 2021. Prices for all commercial property as a single asset class fell by 0.4 percent from the level of the previous month.
Price appreciation for industrial properties was 0.7 percent for the month and 16.9 percent over the past 12 months. Both of these rates of increase remain the highest of any major commercial property type covered in the report.
The poorest performing CPPI for a property type on a year-over-year basis was that for offices within central business districts (CBD). This index was down 0.3 percent for the month and up only 1.9 percent for the year. The CPPI for retail properties was down 0.3 percent for the month and up 8.2 percent for the year.
Multifamily annual price growth slows
The first chart, below, plots the year-over-year changes in the values of the CPPI since January 2012 for all commercial property as a single asset class and for apartments. This chart shows the brief dip in year-over-year price growth in the early months of the pandemic and the huge surge in price growth that followed.
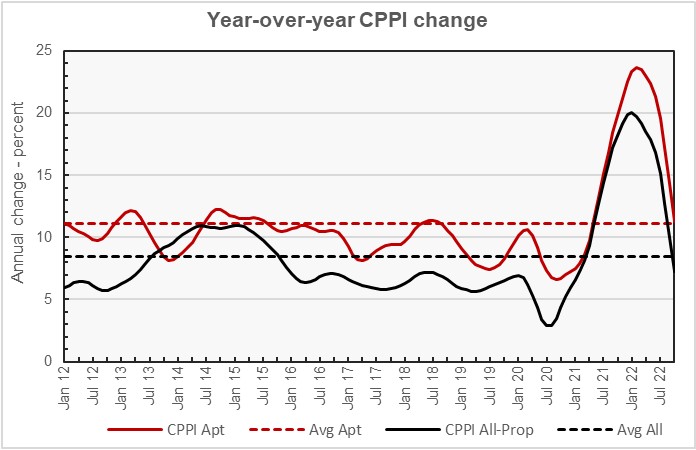
The chart also shows the average rates of annual appreciation in the indexes for the two property classes. The average annual appreciation for multifamily property prices since January 2012 is 11.1 percent, while the average annual appreciation rate for all commercial property as a single asset class is 8.4 percent. The year-over-year price appreciation for all commercial property as a single asset class is now below its long-term average while that for apartments is only slightly above its long-term average.
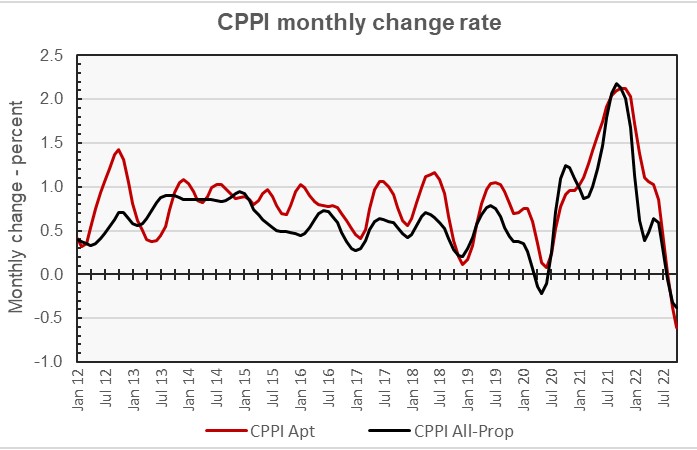
The next chart shows the month-over-month change in these two CPPI values since 2012. It shows more clearly how prices are falling.
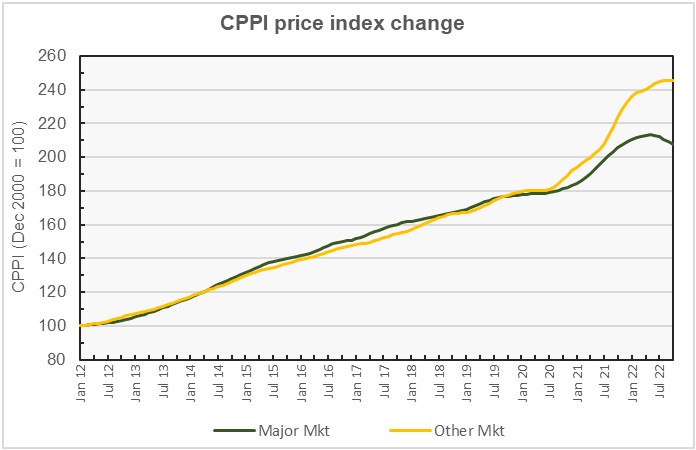
Major metros continue to lag
The MSCI report provides data comparing the price changes of commercial property in 6 major metro areas* against those in the rest of the country, although it does not separate out apartments from other commercial property types in this comparison. The next chart, below, plots the history of the price indexes since January 2012 for both market segments. It shows that the two price indexes rose in lockstep until 2021 when commercial property price appreciation in the non-major markets outpaced that in major markets. Currently, cumulative price appreciation in non-major markets since January 2012 is 18 percent higher than that in major markets.
The final chart plots the history of the year-over-year change in the price indexes for the two property markets since January 2012 along with the average rates of price appreciation for the two market segments for the period between January 2012 and December 2019. The latter two lines are nearly coincident.
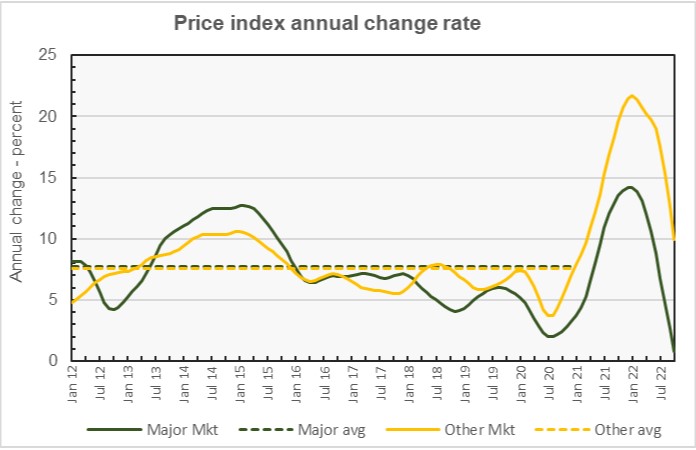
The chart shows the edge that non-major markets have in their rate of year-over-year price appreciation since the pandemic. It also shows that, while the rates of price appreciation have recently fallen for both market segments, major market price appreciation is well below its 8-year average leading up to 2020.
By the numbers, price appreciation for commercial property in major markets was reported to be -0.8 percent for the month and 0.8 percent for the year. Price appreciation for commercial property in non-major markets was reported to be unchanged month-over-month and up 9.9 percent year-over-year. The average rates of price appreciation from 2012 through 2019 are 7.8 percent for major markets and 7.6 percent for non-major markets.
The full report provides more detail on other commercial property types. Access to the MSCI report can be obtained here.
*The major metros are Boston, Chicago, Los Angeles, New York, San Francisco and Washington DC.


