

The Census Bureau’s report on construction spending shows that the value of multifamily residential construction put in place in October was up 0.6 percent month-over-month. Spending on single-family fell for the 6th month in a row while spending on improvements rose.
Single-family decline continues
The reported value of total private residential construction put in place in October 2022 was $887.2 billion on a seasonally adjusted, annualized basis. This figure, which includes spending on both new construction and on improvements, was reported to be down $2.7 billion from September’s revised figure despite September’s spending being revised downward by $28.0 billion in this month’s report. Residential construction spending in October was up 8.6 percent year-over-year.
The value of new private construction of multifamily residential buildings put in place in October was reported to be $102.6 billion on a seasonally adjusted, annualized basis. This was up $569 million from the revised (+$472 million) level for September. The value of multifamily housing construction put in place in October 2022 was 1.6 percent higher than the level of October 2021.
By comparison, the Census Bureau’s New Residential Construction report said that the number of unit completions in October in buildings with 5 or more units was down 5 percent for the month but up 18 percent year-over-year.
State and local governments were reported to have put $9.3 billion in residential construction in place in October on a seasonally adjusted annualized basis.
The value of new single-family residential construction put in place in October was $410.1 billion on a seasonally adjusted, annualized basis. This was down $10.8 billion (2.6 percent) from the revised (-$2.8 billion) level for September and was down 5.4 percent from the level of October 2021.
The value of improvements to residential buildings put in place in October was reported to be $374.6 billion on a seasonally adjusted, annualized basis. This was up 32.6 percent from the year-earlier level and was up 2.1 percent from the sharply revised (-$25.7 billion) level for September. The Census Bureau does not separate out improvements for single-family and multifamily residential buildings.
Charting the data
The following chart shows the value of residential construction put in place each month since January 2001.
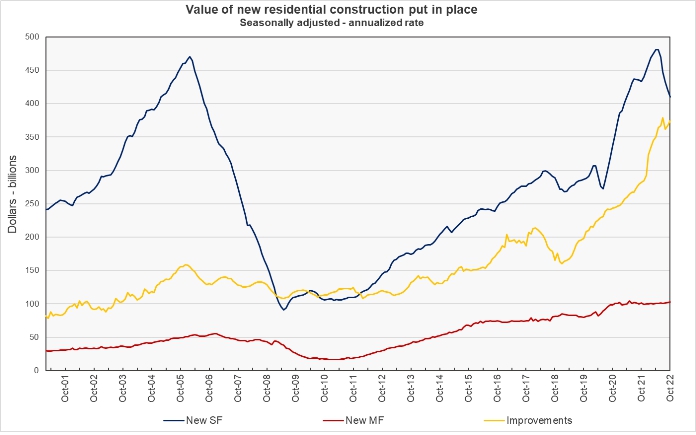
The chart shows that the surge in spending on single-family housing and on residential improvements since June 2020 largely passed by multifamily housing. However, so far the bust in single-family housing spending has also not appeared in the spending on multifamily housing.
Spending on residential improvements climbed this month, but only because of downward revisions to last month’s figure. Improvements now account for 42 percent of total residential construction spending.
The report from the Census Bureau also includes information on spending on other types of construction projects. The full report can be found here.


