

The latest rent report from Apartment List shows that the national average monthly rent growth in February was a positive 0.3 percent, breaking a string of 5 monthly declines. Year-over-year rent growth was 3.0 percent, in line with pre-pandemic levels.
Tracking rent growth trends
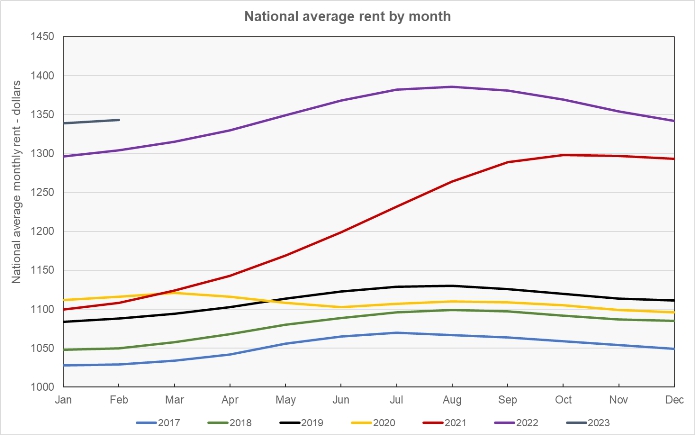
The first chart shows the history of the national average rent level since 2017. It is plotted year-by-year so that the annual change pattern is visible. While rents are starting the year at a high level, their rate of increase is similar to that seen in earlier years.
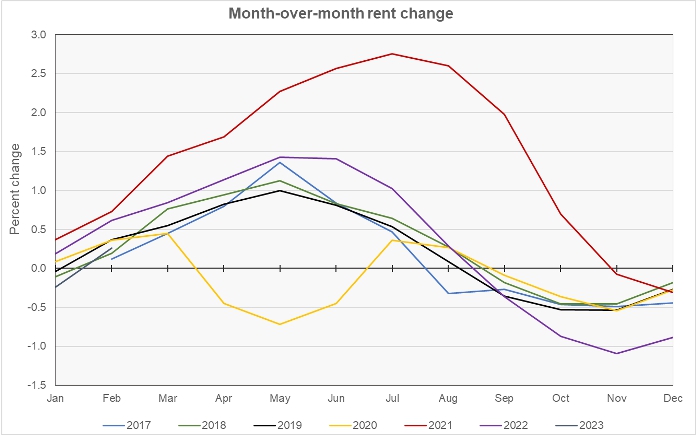
The next chart shows the month-over-month rent growth rate for all of the years in the Apartment List data set. It shows that rent growth is recovering from its worst ever month-over-month declines, which were seen between September 2022 and January 2023. Month-over-month rent growth this February was higher than that seen in either 2017 or 2018, but lower than in the other years for which Apartment List has data.
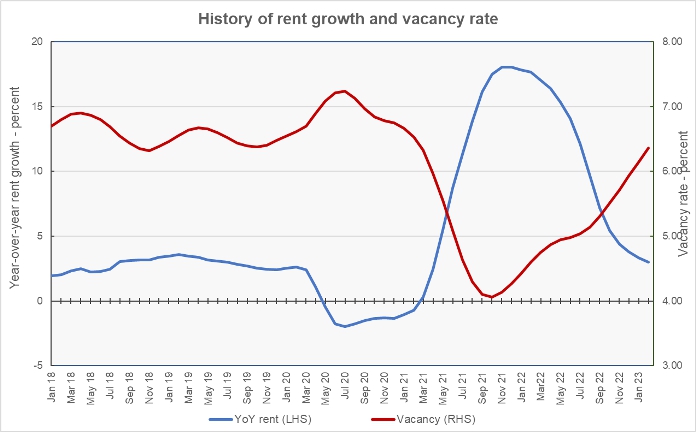
The final chart shows the year-over-year rate of rent growth since January 2018 plotted along with the national average apartment vacancy rate. It shows that both rents and vacancies are approaching pre-pandemic ranges. The current vacancy rate is 6.4 percent while the average rate for the period from January 2018 through January 2020 is 6.6 percent. The current year-over-year rent growth rate is 3.0 percent while the average rate for the period from January 2018 through January 2020 is 2.8 percent.
Leaders and trailers
Apartment List provides the underlying data they collected in compiling their report and that data was used to create the tables, below. The tables look at the 50 most populous metropolitan statistical areas defined by the US Census Bureau and identify the top and bottom 10 metros for year-over-year rent growth. The tables provide the average monthly rent in the metro, the metro’s vacancy rate, the annual percentage change in rent (YoY Metro) along with the percentage change from the prior month’s rent level (MoM Metro). They also list the percentage change in rent for the metro area compared to the rent level in February 2020, right before the pandemic struck (Feb 20).
The first table shows the 10 metros with the largest annual rent percentage increases. Two of the top ten metros for year-over-year rent growth, and 38 of the top 50 metros by population saw their rents rise month-over-month.
| Metro | Metro Rent | Vacancy | YoY Metro | MoM Metro | Feb 20 |
| Oklahoma City | $1,117 | 6.6 | 6.8 | 0.51 | 27.2 |
| Hartford | $1,465 | 7.0 | 6.7 | 0.73 | 23.8 |
| Indianapolis | $1,172 | 5.9 | 6.5 | (0.84) | 26.8 |
| Chicago | $1,373 | 5.2 | 6.2 | 1.03 | 13.7 |
| Columbus | $1,223 | 4.8 | 5.9 | (0.24) | 21.4 |
| Cincinnati | $1,119 | 8.1 | 5.9 | 0.12 | 24.7 |
| Louisville | $1,047 | 6.8 | 5.6 | 0.59 | 16.3 |
| Kansas City | $1,182 | 8.1 | 5.5 | 0.44 | 18.2 |
| Boston | $1,902 | 7.0 | 5.0 | 1.51 | 13.8 |
| Milwaukee | $1,101 | 5.1 | 4.9 | 0.17 | 16.4 |
The next table shows the 10 metros with the smallest annual rent increases. Many of the metros appearing in this table have historically been among the rent growth leaders.
| Metro | Metro Rent | Vacancy | YoY Metro | MoM Metro | Feb 20 |
| Las Vegas | $1,491 | 5.3 | (3.2) | 0.12 | 28.1 |
| Phoenix | $1,579 | 5.4 | (2.9) | (0.31) | 29.6 |
| Sacramento | $1,708 | 6.9 | (2.2) | (0.19) | 20.8 |
| New Orleans | $1,187 | 9.2 | (1.8) | (0.03) | 15.2 |
| Riverside | $1,910 | 4.3 | (0.7) | (0.13) | 32.0 |
| Detroit | $1,123 | 6.0 | 0.0 | 0.02 | 16.1 |
| San Francisco | $2,074 | 5.8 | 0.0 | 0.14 | (4.2) |
| Atlanta | $1,534 | 6.6 | 0.4 | 0.15 | 26.0 |
| Jacksonville, FL | $1,496 | 6.6 | 1.1 | (0.54) | 31.8 |
| Tampa | $1,647 | 7.0 | 1.3 | 0.79 | 38.1 |
The complete Apartment List report covers many more metros. It also provides readers with the opportunity to download their data sets. It can be found here.


