

The Job Openings and Labor Turnover (JOLT) report from the Bureau of Labor Statistics (BLS) said that the number of job openings in January was 10.82 million, down from the preliminary figure reported last month. Hiring was up slightly from last month’s revised figure for the economy as a whole, while total separations were nearly unchanged. Within total separations, quits edged lower rose while layoffs rose.
Note: the BLS used updated employment statistics estimates and updated seasonal adjustment factors in reporting this month’s data. They revised all of their previously reported data back to January 2018. Therefore, revisions to prior month’s data in this report are larger than usual.
Employment rises despite fall in openings
For a discussion of the JOLT report and how it relates to the Employment Situation Report, please see the paragraph at the end of this article.
The BLS reported that job openings were down by 410,000 at the end of January from the revised (+222,000) level of the month before. The January job openings figure represents 6.5 percent of total employment plus job openings. For comparison, the unemployment rate in January was reported to be 3.4 percent and 5.7 million people were unemployed. Another 5.3 million people said that they would like a job but were not counted as being in the labor force since they were not actively seeking employment.
The number of people hired for a new job in January was 6.37 million, while the number of people leaving their old jobs was 5.90 million. Of those leaving their jobs, 3.88 million quit voluntarily, representing 65 percent of total separations, while 1.72 million people were involuntarily separated from their jobs. The remainder of people leaving their jobs left for other reasons, such as retirements or transfers. The portion of people quitting their jobs was down from last month’s figure at 2.5 percent of the labor force. The involuntary separations rate was up slightly from last month’s revised figure at 1.1 percent.
Construction job openings plunge
The first chart, below, shows the employment situation for the construction jobs market over the last 37 months. It shows that January saw a net increase of 26,000 jobs.
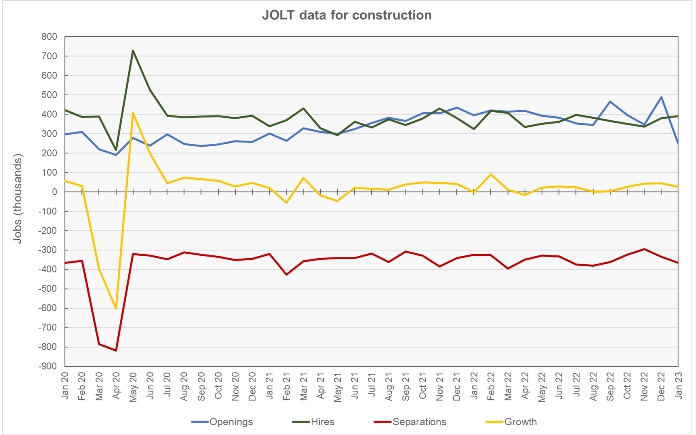
Construction jobs openings in January were reported to be 248,000 jobs, 37 percent lower than the year-earlier level. On a month-over-month basis, openings for construction jobs were reported to fall by 240,000 openings from December’s revised (+75,000) job openings figure. Job openings in the construction category represent 3.0 percent of total employment plus job openings, down from the 5.0 percent level reported last month.
Hiring was reported to be up by 11,000 jobs in January from the prior month’s revised (+23,000) jobs figure at 391,000 new hires. The number of construction jobs that were filled in January was reported to be up 20 percent year-over-year.
Construction jobs total separations were reported to rise by 30,000 jobs from the prior month’s revised (+11,000) figure to 365,000 jobs. Quits were reported to rise by 23,000 jobs from December’s revised (-5,000) figure to a level of 176,000 jobs. Layoffs were reported to rise by 6,000 from December’s revised (+13,000 jobs) figure to 172,000 jobs. “Other separations” which includes retirements and transfers, were reported to be up 1,000 at 17,000 jobs. Quits represented 48 percent of separations for the month, up from the revised level of 46 percent reported for December.
RERL job openings also fall sharply
The last chart, below, shows the employment situation for the real estate and rental and leasing (RERL) jobs category. Employment in this jobs category was reported to rise by 8,000 jobs in January. Data revisions resulted in last month’s reported employment gain being revised lower to a gain of 13,000 jobs.

The number of job openings in the RERL category was 114,000 jobs at the end of January. This was reported to be down 51,000 job openings from the revised (+8,000) level of the month before. Job openings in January were 17 percent lower than their year-earlier level. Job openings in the RERL category represent 4.5 percent of total employment plus job openings.
Hiring in January was up by 9,000 jobs from December’s revised (+8,000) level at 91,000 jobs. This hiring figure was 20 percent above the year-earlier level.
Total separations in the RERL jobs category in January were up 14,000 jobs from December’s revised (+8,000) figure at 83,000 jobs. Quits were unchanged from December’s revised (+1,000) figure at 46,000 jobs. Quits represented 55 percent of total separations in January, down from the revised level of 67 percent for December.
The numbers given in the JOLT report are seasonally adjusted and are subject to revision. It is common for small adjustments to be made in subsequent reports, particularly to the data for the most recent month. The full current JOLT report can be found here.
Comparing the reports
The US labor market is very dynamic with many people changing jobs in any given month. The JOLT report documents this dynamism by providing details about job openings, hiring and separations. However, it does not break down the jobs market into as fine categories as does the Employment Situation Report, which provides data on total employment and unemployment. For example, while the Employment Situation Report separates residential construction from other construction employment, the JOLT report does not. The Employment Situation Report separates residential property managers from other types of real estate and rental and leasing professionals, but the JOLT report does not. However, the JOLT report provides a look at what is driving the employment gains (or losses) in broad employment categories.


