

The latest commercial property price report from MSCI Real Capital Analytics said that multifamily property prices fell 2.7 percent in February from their level of the month before. This was the largest month-over-month decline for any of the commercial property types tracked in the report. Multifamily property prices were reported to be down 8.7 percent year-over-year. The year-over-year multifamily property price growth rate has fallen every month since reaching a high in July 2022.
Defining CPPI
MSCI tracks an index called the Commercial Property Price Index (CPPI). The index is computed based on the resale prices of properties whose earlier sales prices and sales dates are known. The index represents the relative change in the price of property over time rather than its absolute price. Note that, as properties are added to the MSCI dataset each month, they recalculate the CPPI all the way back to the beginning of the data series.
Industrial remains positive
Prices for all commercial property types tracked by MSCI fell month-over-month in February. On a year-over-year basis, only industrial property saw positive price growth, with its price index rising 3.6 percent. Prices for all commercial property as a single asset class fell 6.9 percent year-over-year in February. Prices for all commercial property as a single asset class fell by 2.2 percent from the level of the previous month.
In a reversal of recent patterns, the best performing CPPI for a property type in February on a month-over-month basis was that for offices within central business districts (CBD). This index was down only 0.2 percent for the month. However, this index was down 3.6 percent for the year. It was also by far the worst performing of the indexes tracked by MSCI on a 3-year and 5-year basis with rises of only 1.5 percent and 9.0 percent respectively.
The CPPI for retail properties, another recent laggard, was down 1.0 percent for the month and down 2.2 percent for the year.
Multifamily leads the decline
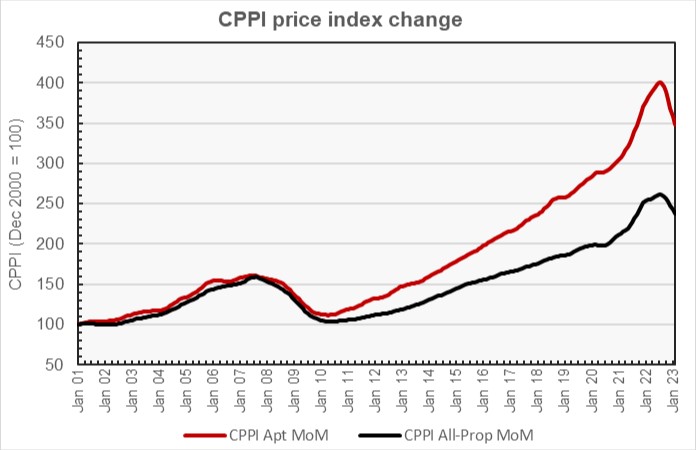
The first chart, below, shows how the CPPI’s for all commercial property and for apartments have changed since January 2012. To simplify the comparison, both CPPI’s have been normalized to a value of 100 in January 2012. The chart illustrates the recent sharp decline in multifamily property prices.
The next chart plots the year-over-year changes in the values of the CPPI since January 2012 for all commercial property as a single asset class and for apartments. The chart shows that the year-over-year rate of price increases for both property classes peaked in early 2022. The latest data shows that year-over-year price growth for both property classes have now been negative for three months in a row.
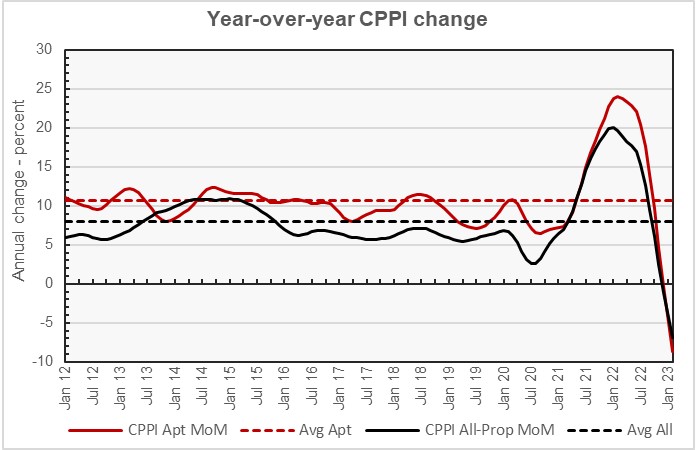
The chart also shows the average rates of annual appreciation in the indexes for the two property classes. The average annual multifamily property price appreciation since January 2012 is 10.6 percent, while the average annual appreciation rate for all commercial property as a single asset class is 8.0 percent.
Major metros fall behind
The MSCI report provides data comparing the price changes of commercial property in 6 major metro* areas against those in the rest of the country, although it does not separate out apartments from other commercial property types in this comparison. The next chart, below, plots the history of the price indexes since January 2012 for both market segments.
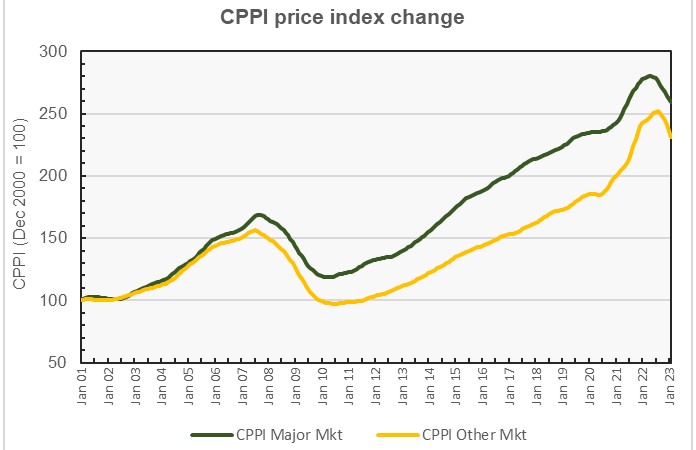
The chart shows that the long-term price appreciation in major metro areas has outpaced that in other areas. While price appreciation in the non-major metros exceeds that in the major metros over the last 1-year, 3-year, 5-year and 10-year time spans, major metros saw smaller declines in prices over the last 1-month and 3-month time spans.
Currently, cumulative price appreciation in non-major markets since January 2012 is 14.2 percent higher than that in major metros.
The final chart plots the history of the year-over-year change in the price indexes for the two groups of property markets since January 2012 along with the average rates of price appreciation for the two market segments for the period between January 2012 and February 2019.
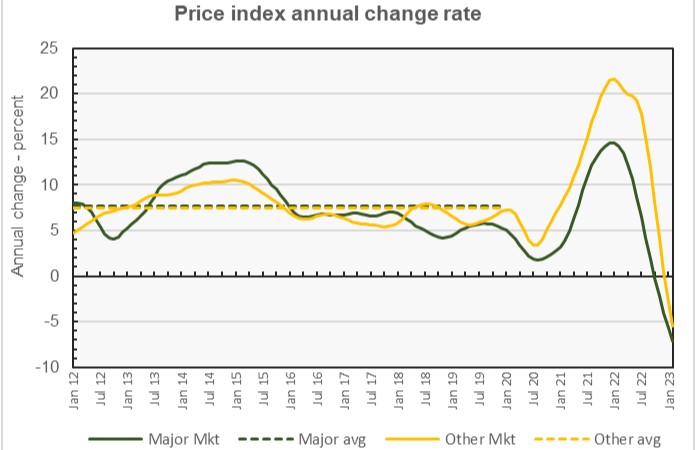
The chart shows that the rates of year-over-year price appreciation for property in both major and non-major markets were trending down from the middle of 2014 until just before the pandemic arrived in early 2020. After the price indexes surged in the middle of the pandemic, a price correction has arrived under the current challenging economic conditions.
By the numbers, price appreciation for commercial property in major metros was reported to be -1.0 percent for the month and -7.1 percent for the year. Price appreciation for commercial property in non-major markets was reported to be -2.0 month-over-month and -5.4 percent year-over-year. The average rates of price appreciation from 2012 through 2019 are 7.6 percent for major metros and 7.5 percent for non-major markets.
The full report provides more detail on other commercial property types. Access to the MSCI report can be obtained here.
*The major metros are Boston, Chicago, Los Angeles, New York, San Francisco and Washington DC.


