

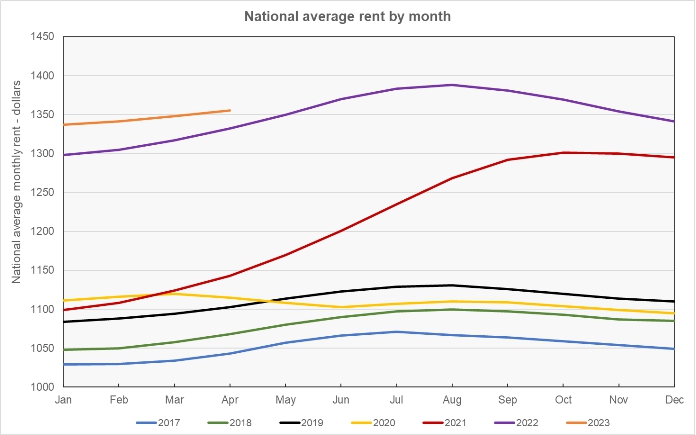
The latest rent report from Apartment List shows that the national average monthly rent growth in April was a positive 0.5 percent, down 0.1 percentage point from last month’s increase. It was the third month in a row with positive rent growth after a string of five months where rents declined. Year-over-year rent growth was 1.7 percent, slightly below typical pre-pandemic levels for this time of the year. Apartment List reported the national average apartment rent to be $1,355.
Plotting the data
The first chart shows the history of the national average rent level since 2017. It is plotted year-by-year so that the annual change pattern is visible.
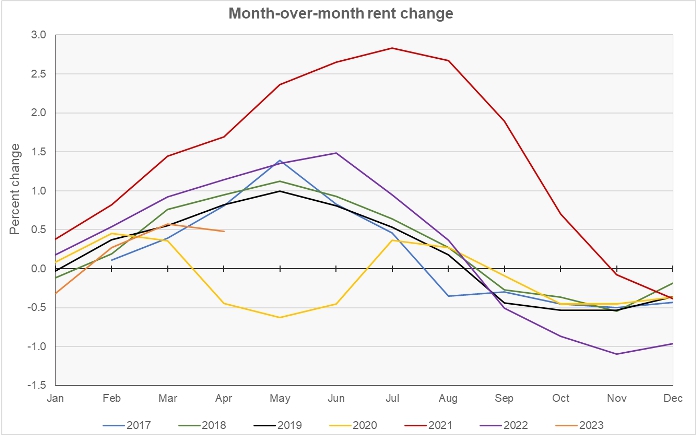
The next chart shows the month-over-month rent growth rate for the 6+ years in the Apartment List data set. It shows that the year-over-year rent growth rate in 2023 in April has dropped below that seen in any of the earlier years except for the pandemic year of 2020.
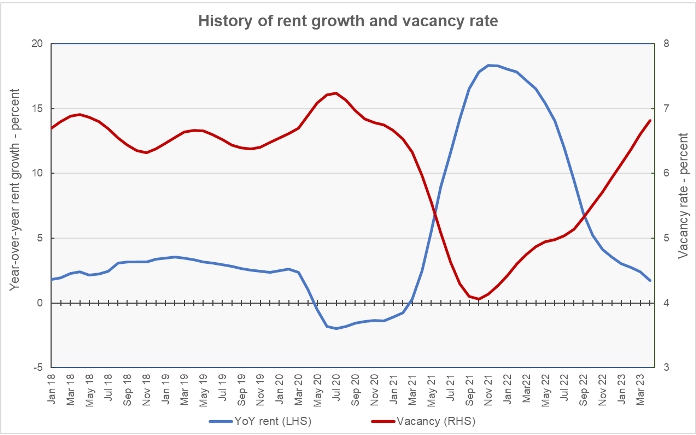
The final chart shows the year-over-year rate of rent growth since January 2018 plotted along with the national average apartment vacancy rate. The current vacancy rate is 6.8 percent, slightly above the average rate for the “normal” period from January 2018 through January 2020. The current year-over-year rent growth rate of 1.7 percent is lower than that seen in any month except for the period from April 2020 to March 2021.
Leaders and trailers
Apartment List provides the underlying data they collected in compiling their report and that data was used to create the tables, below. The tables look at the 50 most populous metropolitan statistical areas defined by the US Census Bureau and identify the top and bottom 10 metros for year-over-year rent growth. The tables provide the average monthly rent in the metro, the metro’s vacancy rate, the annual percentage change in rent (YoY Metro) along with the percentage change from the prior month’s rent level (MoM Metro). They also list the percentage change in rent for the metro area compared to the rent level in February 2020, right before the pandemic struck (Feb 20).
The first table shows the 10 metros with the largest annual rent percentage increases. Many of these metros are centered around midwestern cities that don’t often appear at the tops of lists for rent growth leaders.
| Metro | Metro Rent | Vacancy | YoY Metro | MoM Metro | Feb 20 |
| Cincinnati | $1,146 | 8.4 | 5.8 | 0.78 | 28.8 |
| Chicago | $1,413 | 5.4 | 5.6 | 1.35 | 16.8 |
| Indianapolis | $1,196 | 6.0 | 5.4 | 0.06 | 28.1 |
| Louisville | $1,071 | 7.0 | 4.8 | 0.58 | 18.9 |
| Kansas City | $1,200 | 8.7 | 4.6 | 0.81 | 20.0 |
| Boston | $1,952 | 7.4 | 4.5 | 1.75 | 17.2 |
| St Louis | $1,128 | 5.7 | 4.5 | 0.49 | 18.5 |
| Columbus | $1,230 | 5.2 | 4.2 | 0.37 | 22.9 |
| New York | $2,045 | 4.4 | 3.8 | 1.25 | 17.1 |
| Pittsburgh | $998 | 5.0 | 3.4 | 1.00 | 13.0 |
The next table shows the 10 metros with the smallest annual rent increases.
| Metro | Metro Rent | Vacancy | YoY Metro | MoM Metro | Feb 20 |
| Phoenix | $1,574 | 5.7 | (3.8) | (0.13) | 29.3 |
| New Orleans | $1,184 | 9.1 | (3.7) | (0.44) | 15.1 |
| Las Vegas | $1,492 | 5.4 | (3.7) | 0.25 | 28.5 |
| Sacramento | $1,710 | 7.7 | (3.2) | (0.23) | 20.8 |
| Riverside | $1,933 | 4.5 | (2.0) | 0.34 | 33.8 |
| Salt Lake City | $1,457 | 5.0 | (1.6) | 0.06 | 27.1 |
| San Francisco | $2,093 | 5.9 | (1.5) | 0.42 | (3.3) |
| Detroit | $1,136 | 6.3 | (1.3) | 0.75 | 17.7 |
| Austin | $1,637 | 6.5 | (0.9) | (0.01) | 23.5 |
| Tampa | $1,647 | 7.5 | (0.9) | 0.24 | 38.1 |
In April, 14 of the 50 most populous metros saw their rents decline on a year-over-year basis. Nine of the metros saw rents decline on a month-over-month basis. Only one metro, San Francisco, still has rents that are below their level in February 2020, immediately before the pandemic.
The average rent in the 10 metros with the highest rent growth is $1,338 per month, while the average rent charged in the 10 lowest rent growth metros is 19 percent higher at $1,586 per month. The average vacancy rates for the two groups of metros are nearly the same with an average vacancy rate of 6.3 percent for the high rent growth metros compared to 6.4 percent for the low rent growth rate metros. The average rent growth since February 2020, before COVID struck, is 20.1 percent for the high rent growth metros versus 23.1 percent for the others.
The complete Apartment List report covers many more metros. It also provides readers with the opportunity to download their data sets. The latest report can be found here.


