

Fannie Mae’s April economic and housing forecast reduces the depth of the predicted downturn in multifamily housing starts, although it leaves the timing of the downturn largely unchanged.
Multifamily starts forecast rises
The current forecast for multifamily housing starts is shown in the first chart, below, along with three other recent forecasts. Fannie Mae considers any building containing more than one dwelling unit to be “multifamily”, including both condominiums and rental housing units.
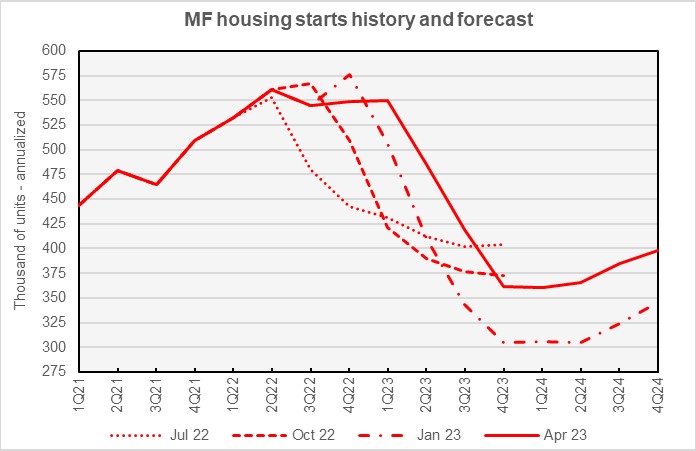
Fannie Mae’s forecasters had been predicting that a downturn in multifamily housing starts would begin in Q1 2023 and reach its lowest point in Q4 2023 to Q1 2024. The current forecast delays the start of the downturn by one quarter but keeps its low point at the same time period. It also raises the predicted lowest number of starts from the 305,000 annualized units predicted in the January forecast shown in the chart but also from the 327,000 annualized units called for in last month’s forecast.
The current forecast calls for the lowest annualized rate of multifamily housing starts (2+ units per building) to be 360,000 units in Q1 2024. Compared to last month’s forecast, the April forecast calls for more multifamily starts in every quarter of 2023 and 2024. Fannie Mae expects multifamily starts for 2022 to come in at 545,000 units, unchanged from the level forecast last month. The forecast for multifamily starts in 2023 is now 454,000 units, up 53,000 units from the level forecast last month, and the forecast for 2024 is 377,000 units, up 34,000 units from last month’s forecast.
The current forecast for single-family housing starts is shown in the next chart, below, along with three other recent forecasts.
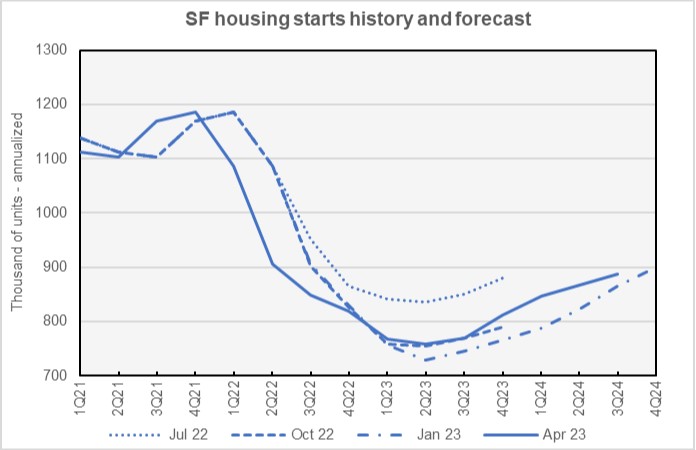
Compared to last month’s forecast, Fannie Mae’s forecasters raised their predicted numbers for single-family starts in every quarter of 2023 and 2024, if only marginally so in many cases. As in last month’s forecast, they expect the low point in single-family housing starts to occur in Q3 2023 and to trend upward after that time.
Fannie Mae expects single-family starts to be 1,008,000 units in 2022, unchanged from the level forecast last month. Fannie Mae raised their forecast for single-family starts in 2023 by 25,000 units to a level of 779,000 units. Fannie Mae’s raised their forecast for single-family starts in 2024 by 5,000 units to a level of 853,000 units.
GDP recovery comes later
The next chart, below, shows Fannie Mae’s current forecast for Gross Domestic Product (GDP) growth, along with their forecast from January.
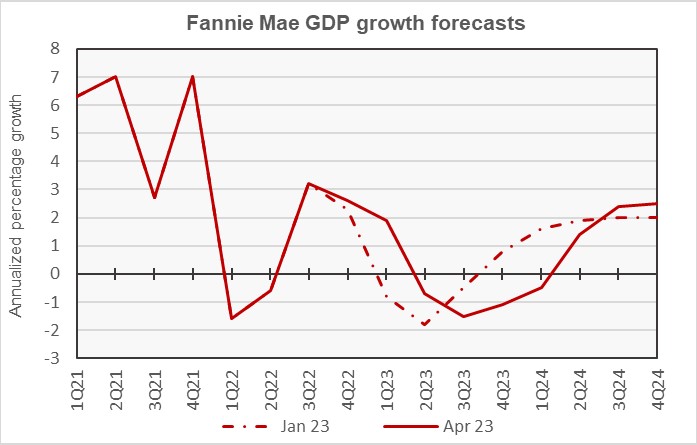
In keeping with the changes Fannie Mae’s forecasters have made in several of their recent forecasts, they slightly delayed the date of the long-predicted recession which is expected to begin later in 2023. While negative GDP growth is still forecast to begin in Q2 2023, it is now expected to persist for one additional quarter, through Q1 2024.
The full year forecast for GDP growth in 2022 is for growth of 0.9 percent, unchanged from last month. The full year GDP forecast for 2023 was revised downward by 0.1 percentage point to -0.4 percent. The full year forecast for 2024 was revised upward by 0.2 percentage points to +1.4 percent.
Inflation forecast largely unchanged
The next chart, below, shows Fannie Mae’s current forecast for the Consumer Price Index (CPI), along with three other recent forecasts.
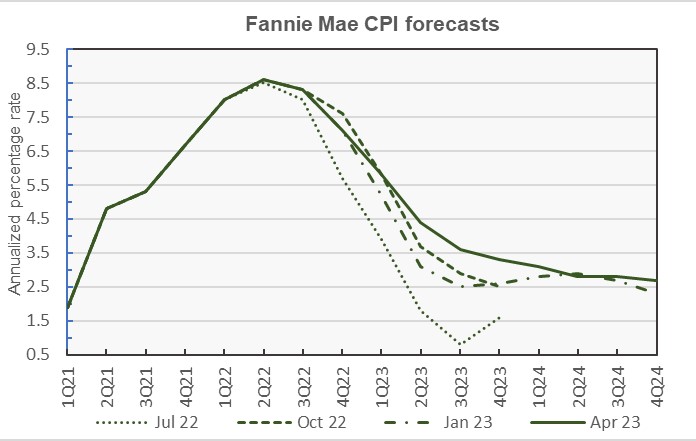
While the current Fannie Mae inflation forecast is significantly different from the January forecast shown in the chart, it is only slightly different from the forecast published last month. Forecasts for 4 of the 8 quarters in 2023 and 2024 were left unchanged from last month’s predictions. Two quarters had their inflation forecasts revised higher and two had theirs revised lower, but none by more than 0.2 percentage points.
Looking at whole-year forecasts, year-over-year CPI growth predicted for Q4 2022 and for Q4 2023 were left unchanged at 7.1 percent and 3.3 percent respectively. The Q4 2024 forecast was revised downward by 0.1 percentage points to 2.7 percent.
Unemployment rate: lower for longer
The next chart, below, shows Fannie Mae’s current forecast for the unemployment rate, along with three other recent forecasts.
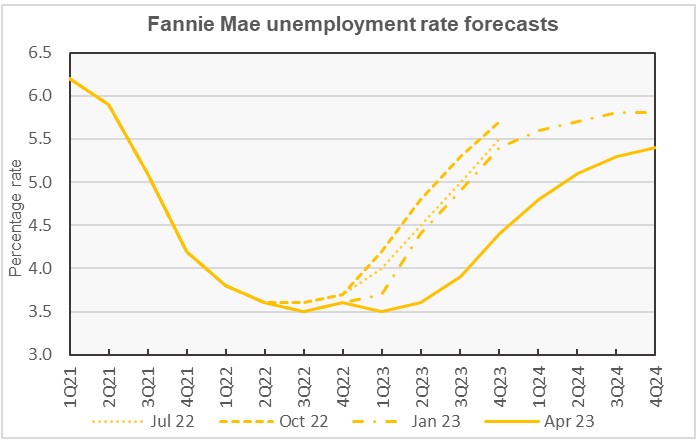
While Fannie Mae’s April unemployment rate forecast is significantly different from January’s forecast shown in the chart, it is only slightly different from last month’s forecast. The unemployment rate forecast was revised downward by 0.1 percentage point for Q3 2023 but was revised upward by 0.1 percentage points for both Q2 and Q3 2024.
The expected full year forecasts for the unemployment rates in 2022 and 2023 were left unchanged at 3.6 percent and 3.9 percent respectively. The unemployment rate forecast for 2024 was revised upward from 5.1 percent to 5.2 percent.
Commentary looks at urban vs suburban performance
The Multifamily Economic and Market Commentary looked at how the results in urban and suburban markets have differed in the period since the COVID pandemic began in early 2020. It recounted how growth in asking rents diverged significantly between these two market segments, particularly in late 2020. However, it noted that this divergence has disappeared for many metro areas. Particularly for sunbelt metros, the total change in rents from Q4 2019 until today for urban and suburban regions of the metros are now very similar.
There are metros areas where total rent growth rates since Q4 2019 are still very different for the metro’s urban and suburban areas. These include West Coast metros where urban rents were very high before the pandemic. It also includes other expensive metros such as Washington D.C. and Philadelphia.
The commentary noted that national average inventory growth in urban areas in the post-pandemic period has been 8.9 percent while growth in suburban areas has been only 5.3 percent. These rates vary significantly for individual metros, with urban Phoenix seeing inventory growth of 37.8 percent while suburban Cleveland saw inventory growth of only 0.5 percent. These variations may help explain why some metros vary from the national patterns for rent growth and vacancy rates.
The commentary concludes by suggesting that the recovery in urban markets relative to their suburban counterparts will continue. However, due to the high level of new supply in the pipeline and anticipated softer demand ahead, the convergence may take some time.
The Fannie Mae forecast can be found here. There are links on that page to the detailed forecasts and to the commentary.


