

The Census Bureau’s new residential construction report for May stated that the number of multifamily permits issued, starts and unit completions were all up for the month, starts significantly so. Starts again outpaced completions so that the number of multifamily units under construction rose to another new high.
The report on single-family housing construction showed that, on a seasonally adjusted basis, single family permits rose 5.2 percent, the fourth monthly increase in a row. Starts also rose, jumping 18.5 percent, while completions climbed 3.9 percent. The reported number of single-family units under construction fell 4,000 to 695,000 units.
Multifamily housing permits rebound
The number of permits issued for buildings with 5 or more units in May was reported to be 542,000 units on a seasonally adjusted, annualized basis. This was up 7.8 percent (39,000 units) from April’s revised figure. May permits were down 11.9 percent from the level recorded in May 2022 and were also down 11.9 percent from the trailing 12-month average.
In addition, 52,000 permits were issued in May for units in buildings with 2 to 4 units. This was down 6,000 units from the revised level for April. May permits for units in buildings with 2 to 4 units were down 13.3 percent from the year-ago level but were up 3 percent from the trailing 12-month average.
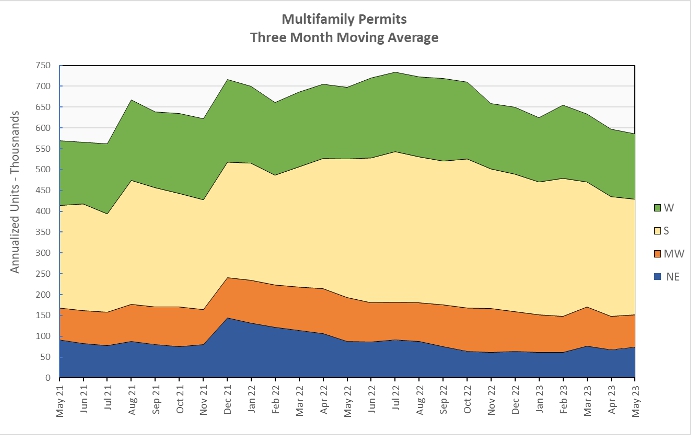
Regional data for multifamily housing is only reported for structures with two or more units. “Structures with 5 or more units” is not broken out as a separate category. Since the regional data is highly volatile and is frequently revised, it is examined here based on three-month weighted moving averages. This averaging helps smooth out the month-to-month variations in the data.
Nationally, the three-month weighted moving average for permits issued for multifamily housing in May was down 2 percent from the level in April and was down 16 percent from the level of May 2022. The three-month weighted moving average for permits came it at 585,000 annualized units.
On a month-over-month basis, the three-month weighted moving average for multifamily permit issuance was up 9 percent in the Northeast but was down 2.9 percent in the Midwest, 3.4 percent in the South and 3.8 percent in the West.
When compared to year-earlier levels, the three-month weighted moving average of permits issued was down 25.5 percent in the Midwest, 16.9 percent in the South, 15.9 percent in the Northeast and 9.0 percent in the West.
The following chart shows the three-month weighted moving averages of permits by region for the last 25 months.
Multifamily housing construction starts surge higher
The preliminary May figure for multifamily housing starts in buildings with 5 or more units was 624,000 units on a seasonally adjusted, annualized basis. This was reported to be up 28 percent (137,000 units) from the revised figure for April. However, the preliminary figure for April reported last month was revised sharply lower this month, falling 55,000 units to 487,000 units.
Compared to the level of May 2022, multifamily housing starts in buildings with 5 or more units were up 30.6 percent. The reported starts figure was 18.9 percent higher than the trailing 12-month average and was 60 percent higher than the monthly average from 2019.
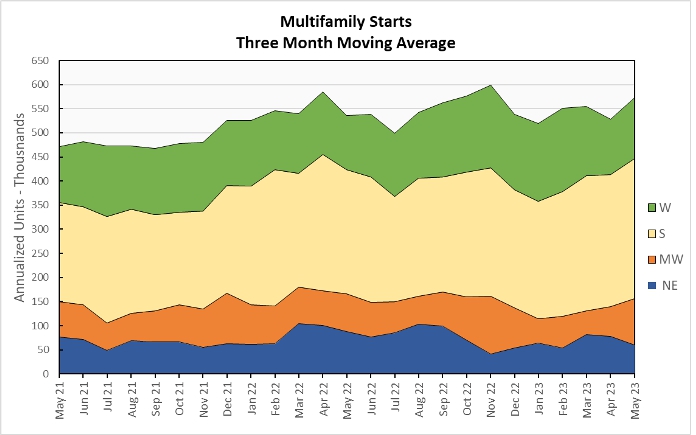
Multifamily housing construction starts (two or more units per building) in May were up 8.4 from their April level for the country as-a-whole, based on three-month weighted moving averages. Starts were up 56 percent in the Midwest, 9.8 percent in the West and 5.9 percent in the South from the levels of the prior month. Starts fell 22.6 percent in the Northeast.
The three-month weighted moving average of starts was up 6.9 percent for the country-as-a-whole on a year-over-year basis. Compared to May 2022, starts were up 22.4 percent in the Midwest, 13.1 percent in the West and 12.6 percent in the South. Starts fell 31.3 percent in the Northeast.
The following chart shows the three-month weighted moving average of starts by region for the last 25 months.
Multifamily housing completions also higher
The preliminary May multifamily housing unit completions figure in buildings with 5 or more units per building was 493,000 units on a seasonally adjusted, annualized basis. This was reported to be up 24.2 percent (96,000 units) from April’s revised figure.
Compared to May 2022, multifamily housing completions in buildings with 5 or more units per building were up 23.9 percent. Compared to the trailing 12-month average, completions were up 23 percent and compared to the monthly average for 2019, completions were up 42 percent.
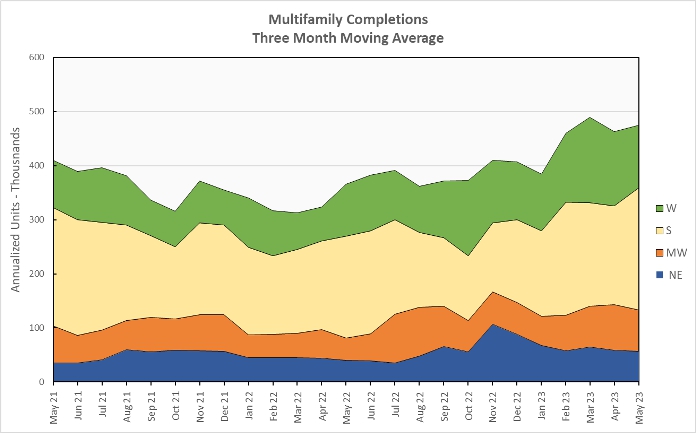
For the country as-a-whole, multifamily housing construction completions (two or more units per building) were up 2.6 percent month-over-month, comparing three-month weighted moving averages. The three-month weighted moving averages of completions was up 23.8 percent in the South. Completions were down 3.1 percent in the Northeast, 9.8 percent in the Midwest and 15.5 percent in the West.
On a year-over-year basis, the three-month weighted moving average of completions in buildings with 2 or more units per building was up 30 percent nationally. Completions were up 88 percent in the Midwest. 41 percent in the Northeast, 21 percent in the West and 19.6 percent in the South.
The three-month weighted moving average of completions by region for the past 25 months are shown in the chart below.
The number of multifamily units under construction was up again in May. The number of units under construction has been flat or higher every month since April 2020. Census reported that there were 978,000 units under construction in buildings with 5 or more units per building on a seasonally adjusted annualized basis. This was reported to be up by 17,000 units from the revised level of the month before. It is 17.3 percent, or 144,000 units, higher than the number of units under construction one year earlier.
All data quoted are based on seasonally adjusted results and are subject to revision.


