

Yardi Matrix reported national average apartment rent growth of $7 in May, bringing rents to $1,716 per month. The increase is up by $2 from last month’s reported value.
Year-over-year rent growth rates down again
The national average asking apartment rent was up 2.6 percent in May from its year-earlier level. This rate of increase was down 0.6 percentage points from that reported last month. This marks 12 months in a row where the rate of year-over-year rent growth has declined. However, this rate of rent growth is in line with the 2.5 percent growth reported for May 2019 and the 2.0 percent growth reported for May 2018.
Rents in the “lifestyle” asset class, usually Class A properties, rose 0.6 percent year-over-year, while rents in “renter by necessity” (RBN) properties increased by 4.5 percent year-over-year. Both rates are once again lower than those reported for the prior month. The chart, below, shows the history of the year-over-year rent growth rates for these two asset classes along with the difference between these rates.
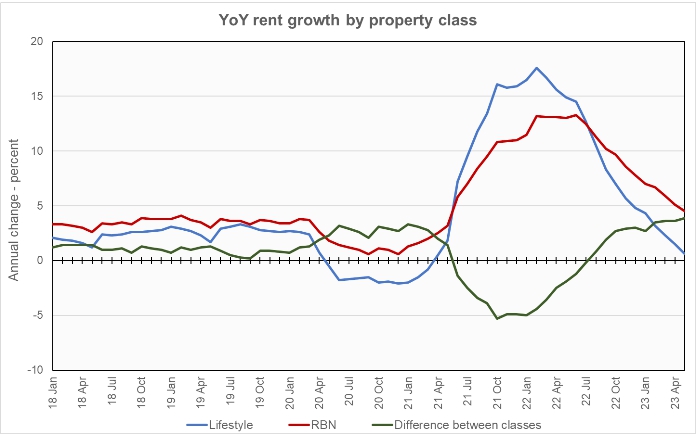
The chart shows that, the year-over-year rent growth rates for both classes of apartments continue to fall, with growth in lifestyle rents approaching negative territory. Meanwhile, the difference in rent growth between the property classes is now higher than it was even during the first year of the COVID pandemic.
By contrast with the year-over-year rent growth results illustrated in the chart, Yardi Matrix noted that month-over-month rent growth in May in lifestyle properties, at 0.4 percent, exceeded the 0.3 percent rent growth at RBN properties.
The national average lease renewal rate was 61.8 percent in March. This is down 2.2 percentage point from the initial value for February reported last month, and also down from the revised level of 64.9 percent for February given in this month’s report. Year-over-year rent growth for leases that were renewed was 8.2 percent in February, down 1.2 percentage point for the month. This remains well above the rent growth rate for new leases but may be explained by landlords bringing the rent levels of their renewed leases to the levels of their current asking rents.
Yardi Matrix reported that U.S. average occupancy rate was nearly unchanged at 95.0 percent in April. Occupancy is down from the year-earlier level of 96.0 percent.
Yardi Matrix also reported that single-family rental (SFR) rents rose $7 in May to a level of $2,100 per month. The year-over-year rent growth rate fell to 2.1 percent. The national occupancy rate for single-family rentals was unchanged from the revised level reported for the month before at 95.6 percent.
Rent growth and more
Yardi Matrix reports on other key rental market metrics in addition to rent growth. These include the average rent to income ratio, the rent growth rate for residents who renew their leases and the portion of residents who renew. The metro averages are included in the tables below, but the report also includes the rent to income ratios for both lifestyle and for RBN properties.
Of the top 30 metros by population, the 10 with the largest annual apartment rent increases as ranked by Yardi Matrix are given in the table below, along with their annual percentage rent changes, overall rent to income ratio, rent growth for renewed leases and renewal rate for the month. The data on asking rent growth is for May. The other data is for April.
| Metro | YoY asking rent growth % | Rent to income ratio % | YoY renewal rent growth % | Monthly lease renewal rate % |
| Indianapolis | 7.0 | 26.1 | 9.4 | 63.8 |
| Kansas City | 6.0 | 25.7 | 7.5 | 66.2 |
| New York | 6.0 | 36.5 | 16.8 | 64.7 |
| Boston | 4.8 | 26.8 | 7.8 | 64.5 |
| Chicago | 4.6 | 29.3 | 4.2 | 65.5 |
| Philadelphia | 3.3 | 28.8 | 7.6 | 77.6 |
| Miami Metro | 2.9 | 26.3 | 13.1 | 69.1 |
| Los Angeles | 2.7 | 32.4 | 4.8 | 43.5 |
| Houston | 2.5 | 28.0 | 6.4 | 59.9 |
| Nashville | 2.3 | 31.2 | 10.0 | 61.3 |
The major metros with the smallest year-over-year apartment rent growth as determined by Yardi Matrix are listed in the next table, below, along with the other data as in the table above.
| Metro | YoY asking rent growth % | Rent to income ratio % | YoY renewal rent growth % | Monthly lease renewal rate % |
| Las Vegas | (2.8) | 28.6 | 8.6 | 56.1 |
| Phoenix | (2.6) | 29.8 | 6.6 | 56.7 |
| Austin | (1.0) | 26.2 | 9.5 | 57.7 |
| Seattle | (0.9) | 28.6 | 9.3 | 55.6 |
| Atlanta | (0.4) | 29.8 | 6.8 | 60.6 |
| Sacramento | (0.4) | 32.7 | 7.1 | 48.6 |
| San Francisco | (0.4) | 32.4 | 1.4 | 46.9 |
| Orange County | (0.2) | 32.4 | 7.0 | 58.5 |
| Inland Empire | 0.7 | 31.5 | 8.9 | 55.9 |
| Orlando | 0.9 | 31.7 | 12.8 | 60.6 |
Twenty-one of the 30 metros tracked saw positive rent growth for the month, the same count as last month. The top metros for month-over month rent growth in May were Chicago, New York and San Jose. The metros with the lowest month-over-month rent growth were Orlando, Sacramento and Phoenix. An indication of the volatility of this metric is that only New York repeats on the top-three list and that San Jose appears on the top-three list after being on the bottom-three list last month.
Short-term headwinds forecast
The discussion section in this month’s report focuses on the high level of new apartment supply expected over the next 18 months. Nearly 900,000 units are forecast to be added to the housing stock over that time. However, the distribution of these new units is very uneven with some high-growth metros receiving much more than their proportional share of the new supply.
Yardi Matrix identified 8 metro areas which will receive new supply of at least 10,000 units representing at least 8 percent of current stock. Leading this list is Austin, which is expecting new supply of 17 percent of current stock. The other metros are Miami, Raleigh-Durham, Charlotte, Salt Lake City, Jacksonville and Phoenix.
Combined with the recent fall-off in household formation, the ample new supply will put stress on the multifamily business over the short term. However, Yardi Matrix expects a reduction in multifamily construction starts will bring supply and demand back into balance.
SFR rent growth hard to find
Yardi Matrix reported on the top 34 metros for single-family rentals. This month, 21 of the 34 metros covered saw positive year-over-year rent growth, the same as last month’s count. The leading metros for year-over-year rent growth were Nashville, Baltimore and Chicago, the same as for the last two months.
This month, only 6 of the metros saw year-over-year occupancy increases for single-family rentals, an increase of 2 from last month’s count. These metros were Orlando, Sacramento, Raleigh, Atlanta, Las Vegas and Baltimore. Washington D.C, Philadelphia and Austin saw the greatest SFR occupancy declines.
The complete Yardi Matrix report provides information on some of the smaller multifamily housing markets. It also has more information about the larger multifamily markets including numbers on job growth and completions of new units. It includes charts showing the history of rent changes in 18 of the top 30 markets over the last 4 years. It can be found here.


