

CoStar reported that its value-weighted index of multifamily property prices fell 19.2 percent year-over-year in June 2023. This index was down 1.4 percent month-over-month.
The value-weighted index of non-multifamily commercial property rose by 1.6 percent, year-over-year, in June. This index rose 1.4 percent month-over-month. The other commercial property types tracked by CoStar are office, retail, industrial and hospitality.
For more information on the CoStar Commercial Repeat Sales Indexes (CCRSI’s), please see the section at the bottom of this report.
YoY multifamily property prices plunge
The first chart, below, shows the history of the value-weighted CCRSI’s since January 2012 for multifamily property and for all other commercial property considered as a single asset class. It also shows trend lines for the growth in the two CCRSI’s based on their growth in the period from January 2012 to January 2020. The indexes are normalized so that their values in December 2000 are set to 100.
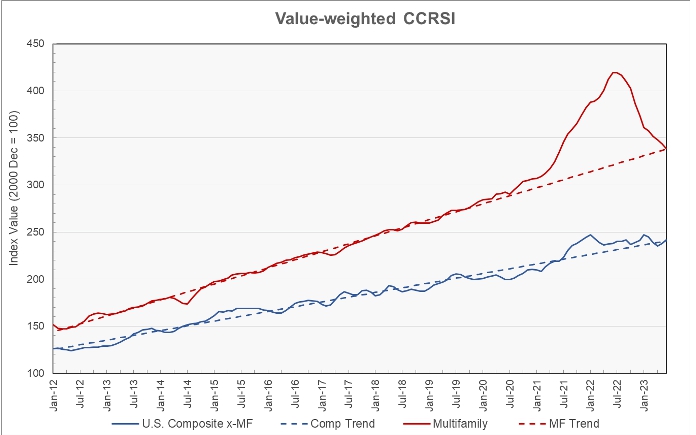
The chart shows that the multifamily property prices went on a wild excursion from trend in the aftermath of the COVID pandemic. Prices for other commercial property, taken as a single asset class, were much less impacted. However, within “other commercial property”, strength in industrial was offset by weakness in office and, to a lesser extent, retail. Currently, both multifamily property prices and prices for other commercial property have returned to their long-term trends; both are within 1 percent of trend.
The second chart shows the year-over-year change in the value-weighted multifamily property price index and that for non-multifamily commercial property since January 2012. It also shows the average rates of annual price growth for the two property classes over that time.
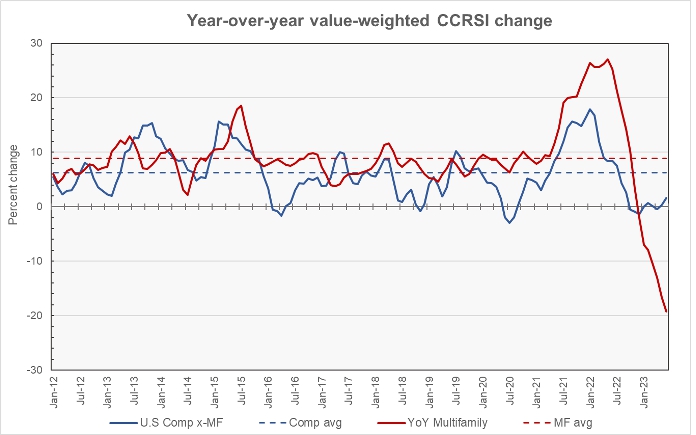
The chart shows that the current year-over-year growth in multifamily property prices is strongly negative. However, the June 2023 price is being compared to the June 2022 price, which was the peak for this cycle. While the July and August 2022 multifamily property prices were also elevated, year-over-year comparisons made after August will benefit from being made to falling prices from the year before.
Non-multifamily commercial property prices have been stable recently on a year-over-year basis but at levels well below recent averages.
Over the period illustrated in the chart, the annual increase in multifamily property prices has been 8.9 percent while that of other commercial property prices has been 6.3 percent.
Regions diverge
CoStar’s quarterly reports include information on changes in the equal-weighted CCRSI by property type by region. The history since Q4 2000 of these regional indexes for multifamily property is shown in the next chart, below.
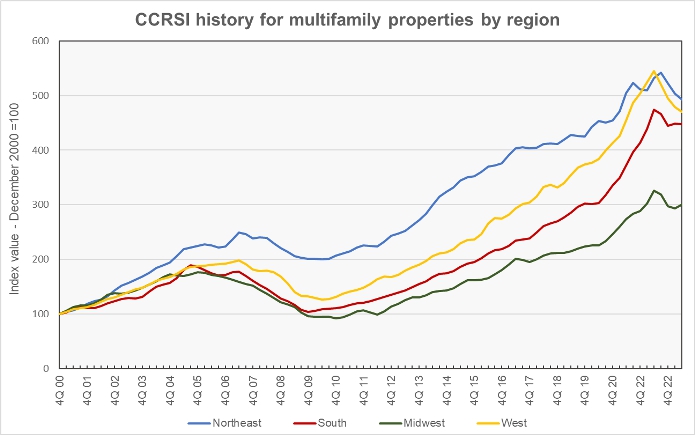
While prices in the Northeast region have risen more than in the other regions since 2000, they have risen at the slowest pace of any of the regions since 2016. Since 2016, the average year-over-year increase in the regional multifamily CCRSI for the Northeast region has been 5.7 percent. The South region has had the highest average rate of price appreciation at 13.0 percent, followed by the West at 11.4 percent and the Midwest at 9.6 percent.
The next chart shows the history of the regional year-over-year multifamily property price changes by quarter since 2016. The chart shows prices falling year-over-year in all regions of the country.
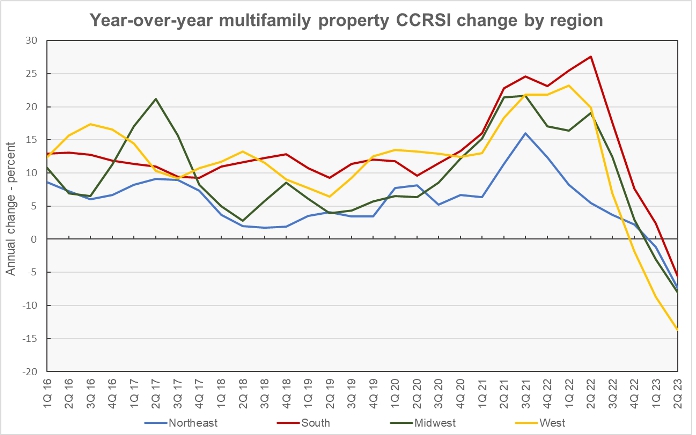
Based on CoStar’s equal-weighted quarterly indexes and comparing to year-earlier levels, prices in Q2 2023 were down by 5.6 percent in the South, 7.4 percent in the Northeast, 8.0 percent in the Midwest and 13.7 percent in the West.
Transaction count down, volume up
An issue with monthly transaction volume reporting is that CoStar usually identifies additional transactions to tabulate over the next few months after the initial report, and these extra transactions tend to make initial reports of declining transaction volumes worse.
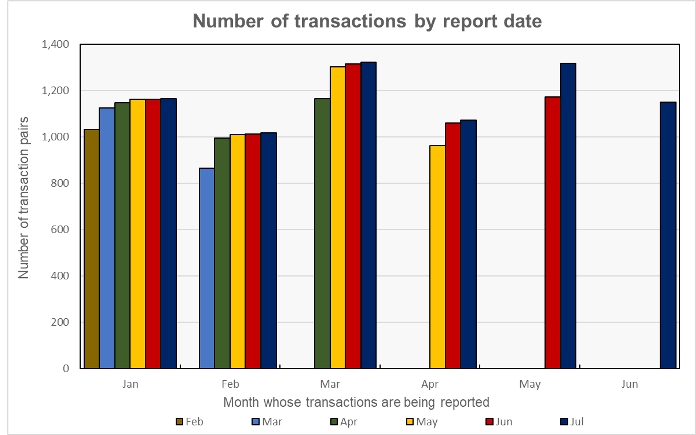
The effect of these revisions is shown in the next chart, below. The cluster of bars at the left side of the chart represent the 6 reports that have been made so far as to the volume of transactions for January 2023. The preliminary volume reported in February 2023 was 1,032 transactions. This count was revised to 1,124 transactions in the March report and to 1,147 transactions in the April report. The current (July) report puts the January transaction count at 1,165. The 13 percent additional transactions identified between February and July can change the assessment of how January’s transaction volume stacks up against that of any month to which it is being compared. Making comparisons based on early reports will tend to accentuate any volume declines and to attenuate any volume increases.
CoStar found that the transaction count declined during June, but that the dollar volume of transactions rose. The preliminary number of transactions reported for June was down 2 percent from the preliminary level of the month before. It was down 13 percent month-over-month from the revised level of the month before contained in the July report.
The preliminary dollar volume of transactions was reported to rise 4 percent from the revised level of the month before. However, it was up 18 percent from the preliminary level reported last month.
The full report discusses all commercial property types. While the CoStar report provides information on transaction volumes, it does not break out multifamily transactions. The latest CoStar report can be found here.
CCRSI defined
The CoStar report focuses on a relative measure of property prices called the CoStar Commercial Repeat Sales Index (CCRSI). The index is computed based on the resale of properties whose earlier sales prices and sales dates are known. The index represents the relative change in the price of property over time rather than its absolute price. CoStar identified 1,150 repeat sale pairs in June for all property types. These sales pairs were used to calculate the results quoted here.
CoStar computes CCRSI’s for a variety of property groupings, combining them by cost, region, property type or other factors. The value-weighted index is more heavily influenced by transactions of expensive properties than is CoStar’s equal-weighted index. The value-weighted index is the focus of this report because it is an index whose level is reported monthly and for which CoStar breaks out multifamily property as a separate category.


