

CoStar reported that its value-weighted index of multifamily property prices rose 1.4 percent month-over-month in July, the first month-over-month increase since June 2022. However, this index fell 18.0 percent year-over-year.
The value-weighted index of non-multifamily commercial property rose by 2.3 percent, year-over-year, in July. This index was also up month-over-month, rising 1.4 percent. The other commercial property types tracked by CoStar are office, retail, industrial and hospitality.
For more information on the CoStar Commercial Repeat Sales Indexes (CCRSI’s), please see the section at the bottom of this report.
Multifamily property prices down YoY
The first chart, below, shows the history of the value-weighted CCRSI’s since January 2012 for multifamily property and for all other commercial property considered as a single asset class. It also shows trend lines for the growth in the two CCRSI’s based on their growth in the period from January 2012 to January 2020. The indexes are normalized so that their values in December 2000 are set to 100.
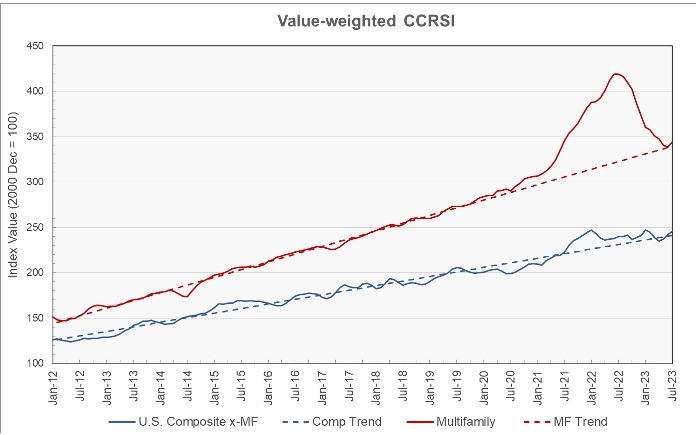
The chart shows that the multifamily property prices have now returned to near where their long-term trend line would predict. This result matches that recently reported by MSCI. However, CoStar judged the month-over-month multifamily property price rise to be larger than MSCI’s figure and CoStar also found the year-over-year price decline to be larger.
CoStar noted that sales that closed in July were initiated in a period when interest rates seemed to be moderating. This may have contributed to the reported month-over-month rise in multifamily property prices. However, recently interest rates have spiked and this may put downward pressure on both property prices and sales volumes over the next few months.
The CoStar data indicates that multifamily property prices are now are 1.1 percent higher than the long-term trend would predict. Prices for non-multifamily commercial property are now 1.8 percent above trend.
The second chart shows the year-over-year change in the value-weighted multifamily property price index and that for all other commercial property types since January 2012. It also shows the average rates of annual price growth for the two property classes over the period shown.
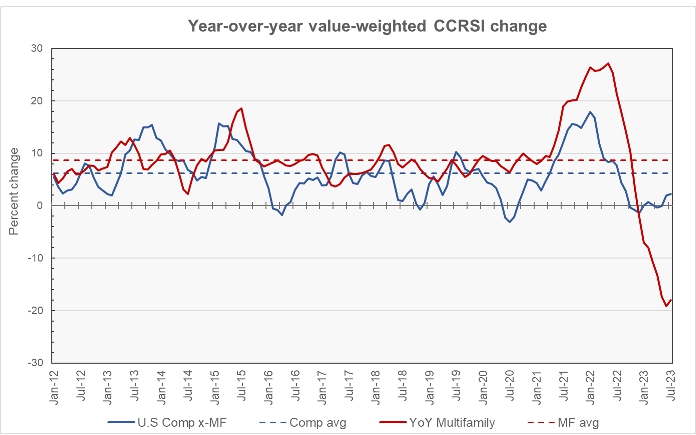
Multifamily property prices started falling in July 2022 and turned negative on a year-over-year basis in December 2022. July was the first month since December in which the rate of year-over-year price decline lessened, dropping from 19.2 percent last month to 18.0 percent this month.
Non-multifamily commercial property prices have risen year-over-year for the last two months. However, over the past 12 months, they have been up 6 times, down 4 times and effectively unchanged twice so no clear trend is visible in this data.
The average annual increase in multifamily property prices over the period shown in the chart has been 8.7 percent while that of other commercial property prices has been 6.2 percent.
Transaction volumes fall
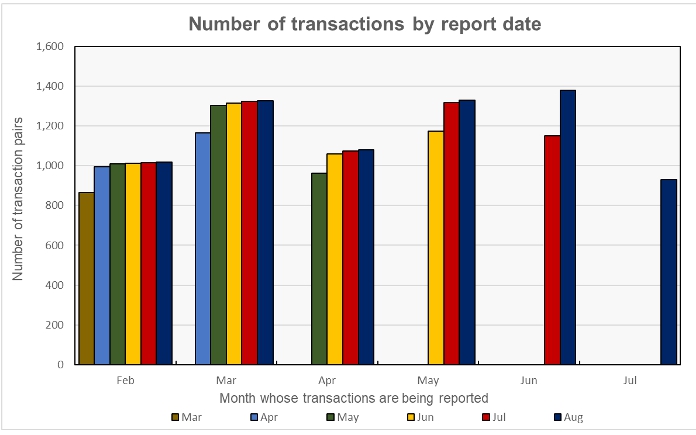
An issue with monthly transaction volume reporting is that CoStar usually identifies additional transactions to tabulate over the next few months after the initial report. Usually the greatest number of additional transaction is found for the next month’s report. These extra transactions tend to make the month’s transaction appear relatively better when comparing to the transaction levels of the months before.
The effect of these revisions is shown in the next chart, below. The cluster of bars at the left side of the chart represent the 6 reports that have been made so far as to the volume of transactions for February 2023. The preliminary volume for February 2023 reported in March was 864 transactions. This count was revised to 994 transactions in the April report and to 1,009 transactions in the May report. The current (August) report puts the February transaction count at 1,019. The 18 percent additional transactions identified between March and August can change the assessment of how February’s transaction volume stacks up against that of any month to which it is being compared. Making comparisons based on early reports will tend to accentuate any volume decline and to attenuate any volume increase.
CoStar found that transaction volumes fell sharply during July. This was true both based on the count of the number of transactions, which fell to 929, and also based on the dollar volume of transactions, which fell to $6.7 billion.
The preliminary number of transactions reported for July was down 19 percent from the preliminary level reported for the month before. However, it was down 33 percent month-over-month from the revised level of the month before contained in this month’s report.
CoStar noted in their commentary that the transaction count for July is lower than the non-COVID era transaction count for any month since February 2013. However, the number of transaction listed is only an initial count. The initial count for July is actually higher than the initial count for February and is not far off from the initial count for April (961). It will be interesting to see where revisions to the July data in subsequent reports place July’s transaction count compared to other months in the dataset.
The preliminary dollar volume of transactions was reported to fall 28 percent from the revised level of the month before. It was down 14 percent from the preliminary level reported last month.
The full report discusses all commercial property types. While the CoStar report provides information on transaction volumes, it does not break out multifamily transactions. The latest CoStar report can be found here.
CCRSI defined
The CoStar report focuses on a relative measure of property prices called the CoStar Commercial Repeat Sales Index (CCRSI). The index is computed based on the resale of properties whose earlier sales prices and sales dates are known. The index represents the relative change in the price of property over time rather than its absolute price. CoStar identified 929 repeat sale pairs in July for all property types. These sales pairs were used to calculate the results quoted here.
CoStar computes CCRSI’s for a variety of property groupings, combining them by cost, region, property type or other factors. The value-weighted index is more heavily influenced by transactions of expensive properties than is CoStar’s equal-weighted index. The value-weighted index is the focus of this report because it is an index whose value is reported monthly and for which CoStar breaks out multifamily property as a separate category.


