

The latest rent report from Apartment List shows that the national median monthly rent growth in September was -0.5 percent. Year-over-year rent growth was -1.2 percent. The month-over-month results are the worst for a September in the Apartment List dataset, which dates to January 2017.
Apartment List reported the national median apartment rent to be $1,364, down $7 from last month’s figure.
Visualizing the data
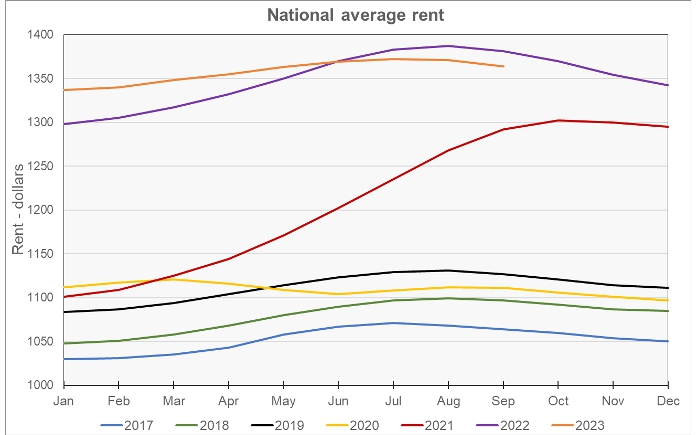
The first chart shows the history of the national median rent level since 2017. It is plotted year-by-year so that the annual change pattern is visible. It shows that rent growth has been negative year-over-year for the last 4 months. By contrast, in the pre-pandemic years of 2018 and 2019, year-over-year rent growth was consistently positive. It ranged from 1.8 percent to 3.5 percent with an average rate of 2.8 percent.
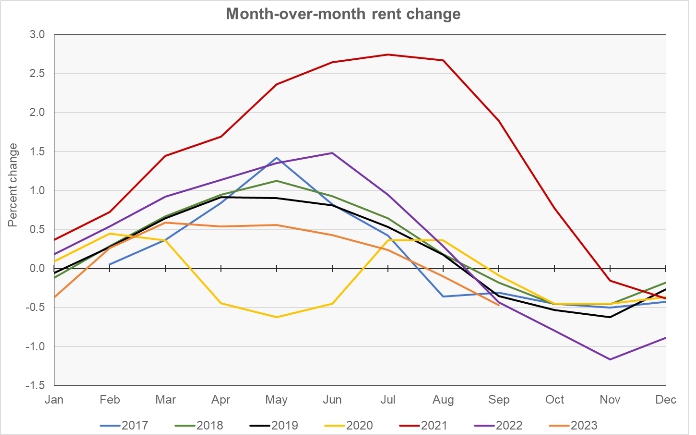
The next chart shows the month-over-month rent growth rate for the Apartment List data set. The chart shows that month-over-month rent growth for 2023 has been some of the lowest in the Apartment List dataset. While month-over-month rent growth for September is the lowest Apartment List has seen, it is only marginally lower than that seen in 2022. In addition, every year other than 2021 saw negative month-over-month rent growth in September as rents entered their winter slump.
The final chart shows the year-over-year rate of rent growth since January 2018 plotted along with the national median apartment vacancy rate.
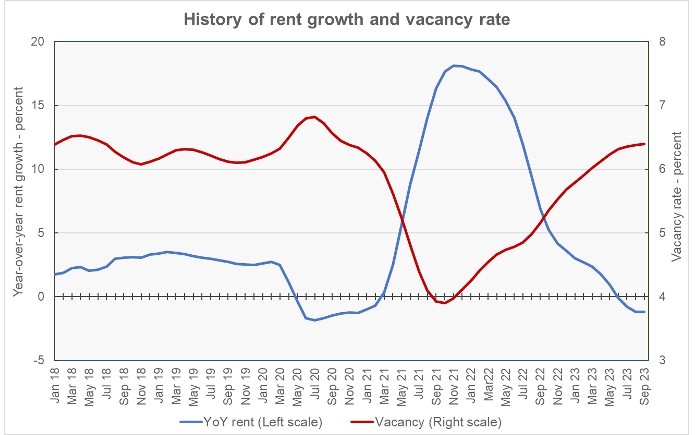
The chart shows that the current vacancy rate is 6.4 percent, in line with the average from 2108 and 2019. The shape of the curve implies that the vacancy rate may be settling in at that level, at least for now. Year-over-year rent growth recently turned negative in June 2023 when the vacancy rate rose to 6.3 percent. The last time rent growth had turned negative was in May 2020 when the vacancy rate hit 6.7 percent and was rising rapidly.
Leaders and trailers
Apartment List provides the underlying data they collected in compiling their report and that data was used to create the tables, below. The tables look at the 50 most populous metropolitan statistical areas defined by the US Census Bureau and identify the top and bottom 10 metros for year-over-year rent growth. The tables provide the median monthly rent in the metro, the metro’s vacancy rate, the annual percentage change in rent (YoY Metro) along with the percentage change from the prior month’s rent level (MoM Metro). They also list the percentage changes in rent for the metro areas compared to the rent levels in February 2020, right before the pandemic struck (Feb 20).
The first table shows the 10 metros with the largest annual rent percentage increases. The list is notable for the absence of fast-growing sunbelt cities.
| Metro | Metro Rent | Vacancy Rate |
YoY Metro | MoM Metro | Feb 20 |
| Hartford | $1,542 | 5.2 | 4.1 | 0.08 | 30.0 |
| Milwaukee | $1,130 | 5.9 | 3.8 | (0.33) | 21.0 |
| Chicago | $1,449 | 5.5 | 3.1 | (0.51) | 19.5 |
| Louisville | $1,108 | 6.2 | 2.7 | 0.14 | 22.8 |
| Kansas City | $1,238 | 6.1 | 2.6 | (0.45) | 23.3 |
| Providence | $1,482 | 4.5 | 2.1 | (0.44) | 34.8 |
| Boston | $2,006 | 5.3 | 1.7 | (0.68) | 20.3 |
| New York | $2,112 | 4.4 | 1.4 | (0.39) | 21.4 |
| Indianapolis | $1,206 | 6.0 | 1.3 | (0.16) | 29.7 |
| Baltimore | $1,666 | 5.1 | 1.2 | (0.35) | 21.8 |
The next table shows the 10 metros with the smallest annual rent increases.
| Metro | Metro Rent | Vacancy Rate |
YoY Metro | MoM Metro | Feb 20 |
| Austin | $1,604 | 8.4 | (6.2) | (1.40) | 20.8 |
| Portland | $1,522 | 6.4 | (5.0) | (0.49) | 14.2 |
| Phoenix | $1,560 | 6.9 | (4.5) | (0.52) | 28.3 |
| Las Vegas | $1,498 | 6.9 | (4.5) | (0.31) | 28.7 |
| Atlanta | $1,516 | 6.9 | (4.2) | (0.84) | 24.7 |
| San Francisco | $2,091 | 5.6 | (4.1) | (0.55) | (3.1) |
| Salt Lake City | $1,460 | 7.9 | (3.9) | (0.29) | 27.1 |
| Orlando | $1,615 | 6.6 | (3.8) | (1.18) | 28.1 |
| Jacksonville | $1,474 | 6.5 | (3.4) | (0.54) | 29.9 |
| Raleigh | $1,519 | 7.4 | (3.4) | (1.08) | 29.7 |
In September, 34 of the 50 most populous metros saw their rents decline on a year-over-year basis, matching last month’s figure. In addition, 46 of the metros saw rents decline on a month-over-month basis. San Francisco remains the only top-50 metro that still has rents that are below their level in February 2020, immediately before the pandemic.
The average rent in the 10 metros with the highest rent growth is $1,494 per month, while the average rent charged in the 10 lowest rent growth metros is 6 percent higher at $1,586 per month.
The average vacancy rate for the high rent growth metros is 5.4 percent compared to 6.9 percent for the low rent growth rate metros. The average rent growth since February 2020, before COVID struck, is 24.5 percent for the high rent growth metros versus 22.8 percent for the others.
The complete Apartment List report covers many more metros in addition to city, county and state data. It also provides readers with the opportunity to download their data sets. The latest report can be found here.


