

The latest rent report from Apartment List shows that the national median monthly rent growth in January was -0.3 percent. Year-over-year rent growth was -1.0 percent. Apartment List reported the national median apartment rent to be $1,373, down $5 from last month’s revised figure.
The month-over-month decline in rents is not unusual for January. January rents have declined for 4 of the 7 years for which Apartment List has data. However, Apartment List has never seen rents fall in February, so a recovery in rents may be at hand.
Charting the data
The first chart shows the history of the national median rent level since 2017. It is plotted year-by-year so that the annual change pattern is visible.
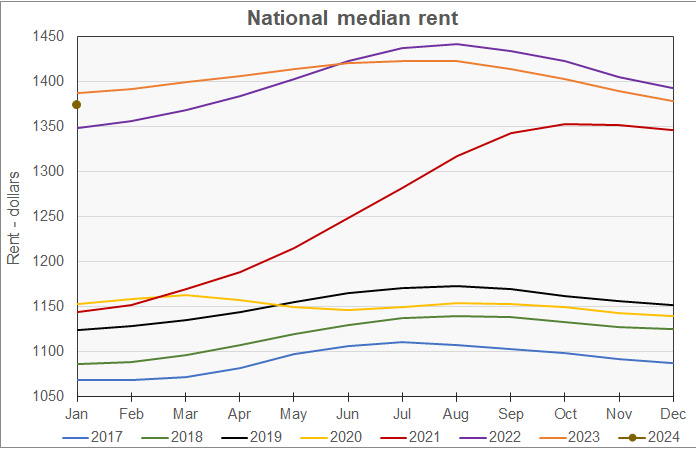
The chart shows that year-over-year rent growth has been negative since June 2023. Other than the 10 months after COVID arrived, this is the only period in the Apartment List data set where year-over-year rent growth has not been positive.
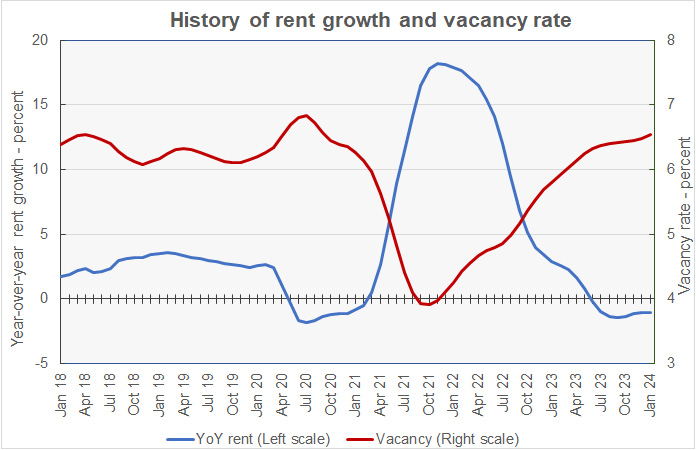
The next chart shows the year-over-year rate of rent growth since January 2018 plotted along with the national median apartment vacancy rate. The chart shows that the vacancy rate has now returned to its pre-pandemic range. However, it also shows that rent growth is running well below its pre-pandemic level.
The final chart shows the change in the national median apartment rent since January 2017 in nominal dollar terms along with two other measures of rent accounting for changes in income and price levels. The Income adjusted curve adjusts the rent by the change in average hourly earnings as reported by the Bureau of Labor Statistics. The Inflation adjusted curve adjusts the rent by the general change in price level as measured by the not-seasonally-adjusted Consumer Price Index for all urban consumers (CPI-U).
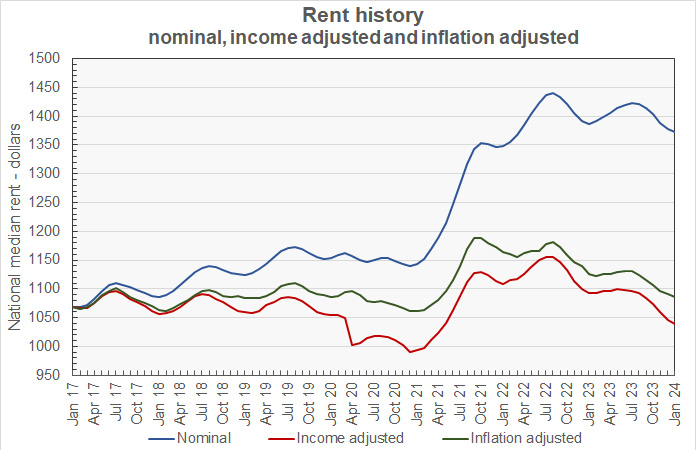
The curves show that, while rents have soared in nominal terms, when adjusted for wage growth or for the general increases in prices, they are much closer to their pre-pandemic levels.
Ranking the metros
Apartment List provides the underlying data they collected in compiling their report and that data was used to create the tables, below. The tables look at the 50 most populous metropolitan statistical areas defined by the US Census Bureau and identify the top and bottom 10 metros for year-over-year rent growth. The tables provide the median monthly rent in the metro, the metro’s vacancy rate, the annual percentage change in rent (YoY Metro) along with the percentage change from the prior month’s rent level (MoM Metro). They also list the percentage changes in rent for the metro areas compared to the rent levels in February 2020, right before the pandemic struck (Feb 20).
The first table shows the 10 metros with the largest annual rent percentage increases. The list is notable for the absence of fast growing sunbelt cities.
| Metro | Metro Rent | Vacancy | YoY Metro | MoM Metro | Feb 20 |
| Providence | $1,358 | 5.0 | 4.1 | (0.64) | 27.2 |
| Hartford | $1,463 | 5.1 | 3.9 | 1.10 | 26.7 |
| Louisville | $1,149 | 5.9 | 3.6 | (0.08) | 20.1 |
| Chicago | $1,542 | 5.2 | 3.3 | (0.33) | 16.6 |
| Washington | $2,079 | 5.2 | 3.2 | (0.25) | 10.8 |
| Grand Rapids | $1,189 | 6.8 | 3.1 | 0.31 | 26.2 |
| Boston | $2,104 | 5.4 | 2.9 | (0.35) | 14.0 |
| Milwaukee | $1,184 | 6.1 | 2.9 | (0.38) | 21.2 |
| New York | $2,156 | 4.3 | 2.8 | (0.58) | 16.2 |
| Virginia Beach | $1,513 | 5.4 | 2.7 | (0.48) | 27.7 |
The next table shows the 10 metros with the smallest annual rent increases.
| Metro | Metro Rent | Vacancy | YoY Metro | MoM Metro | Feb 20 |
| Austin | $1,448 | 9.5 | (6.4) | (1.16) | 14.6 |
| Portland | $1,624 | 6.6 | (4.6) | (0.22) | 10.3 |
| Atlanta | $1,472 | 7.2 | (4.5) | (0.57) | 19.1 |
| Jacksonville | $1,372 | 6.6 | (4.5) | (0.62) | 23.7 |
| Phoenix | $1,439 | 6.9 | (4.1) | (0.36) | 23.6 |
| Nashville | $1,395 | 7.9 | (4.0) | (0.71) | 17.9 |
| Orlando | $1,553 | 6.8 | (3.9) | (0.35) | 23.4 |
| Raleigh | $1,432 | 7.8 | (3.9) | (0.71) | 22.4 |
| San Antonio | $1,243 | 8.5 | (3.5) | (0.40) | 15.1 |
| San Francisco | $2,477 | 5.6 | (3.2) | (0.19) | (7.7) |
In January, 27 of the 50 most populous metros saw their rents rise on a year-over-year basis. In addition, 10 metros saw rents rise on a month-over-month basis, up from only 2 last month. San Francisco and San Jose remain the only metros of the top-50 that have rents that are below their level in February 2020, immediately before the pandemic.
The complete Apartment List report covers many more metros and also provides city, county and state data. It gives readers with the opportunity to download their data sets. The latest report can be found here.


