 The era of fiscal excess, BofA Michael Hartness’s description of today’s government spending
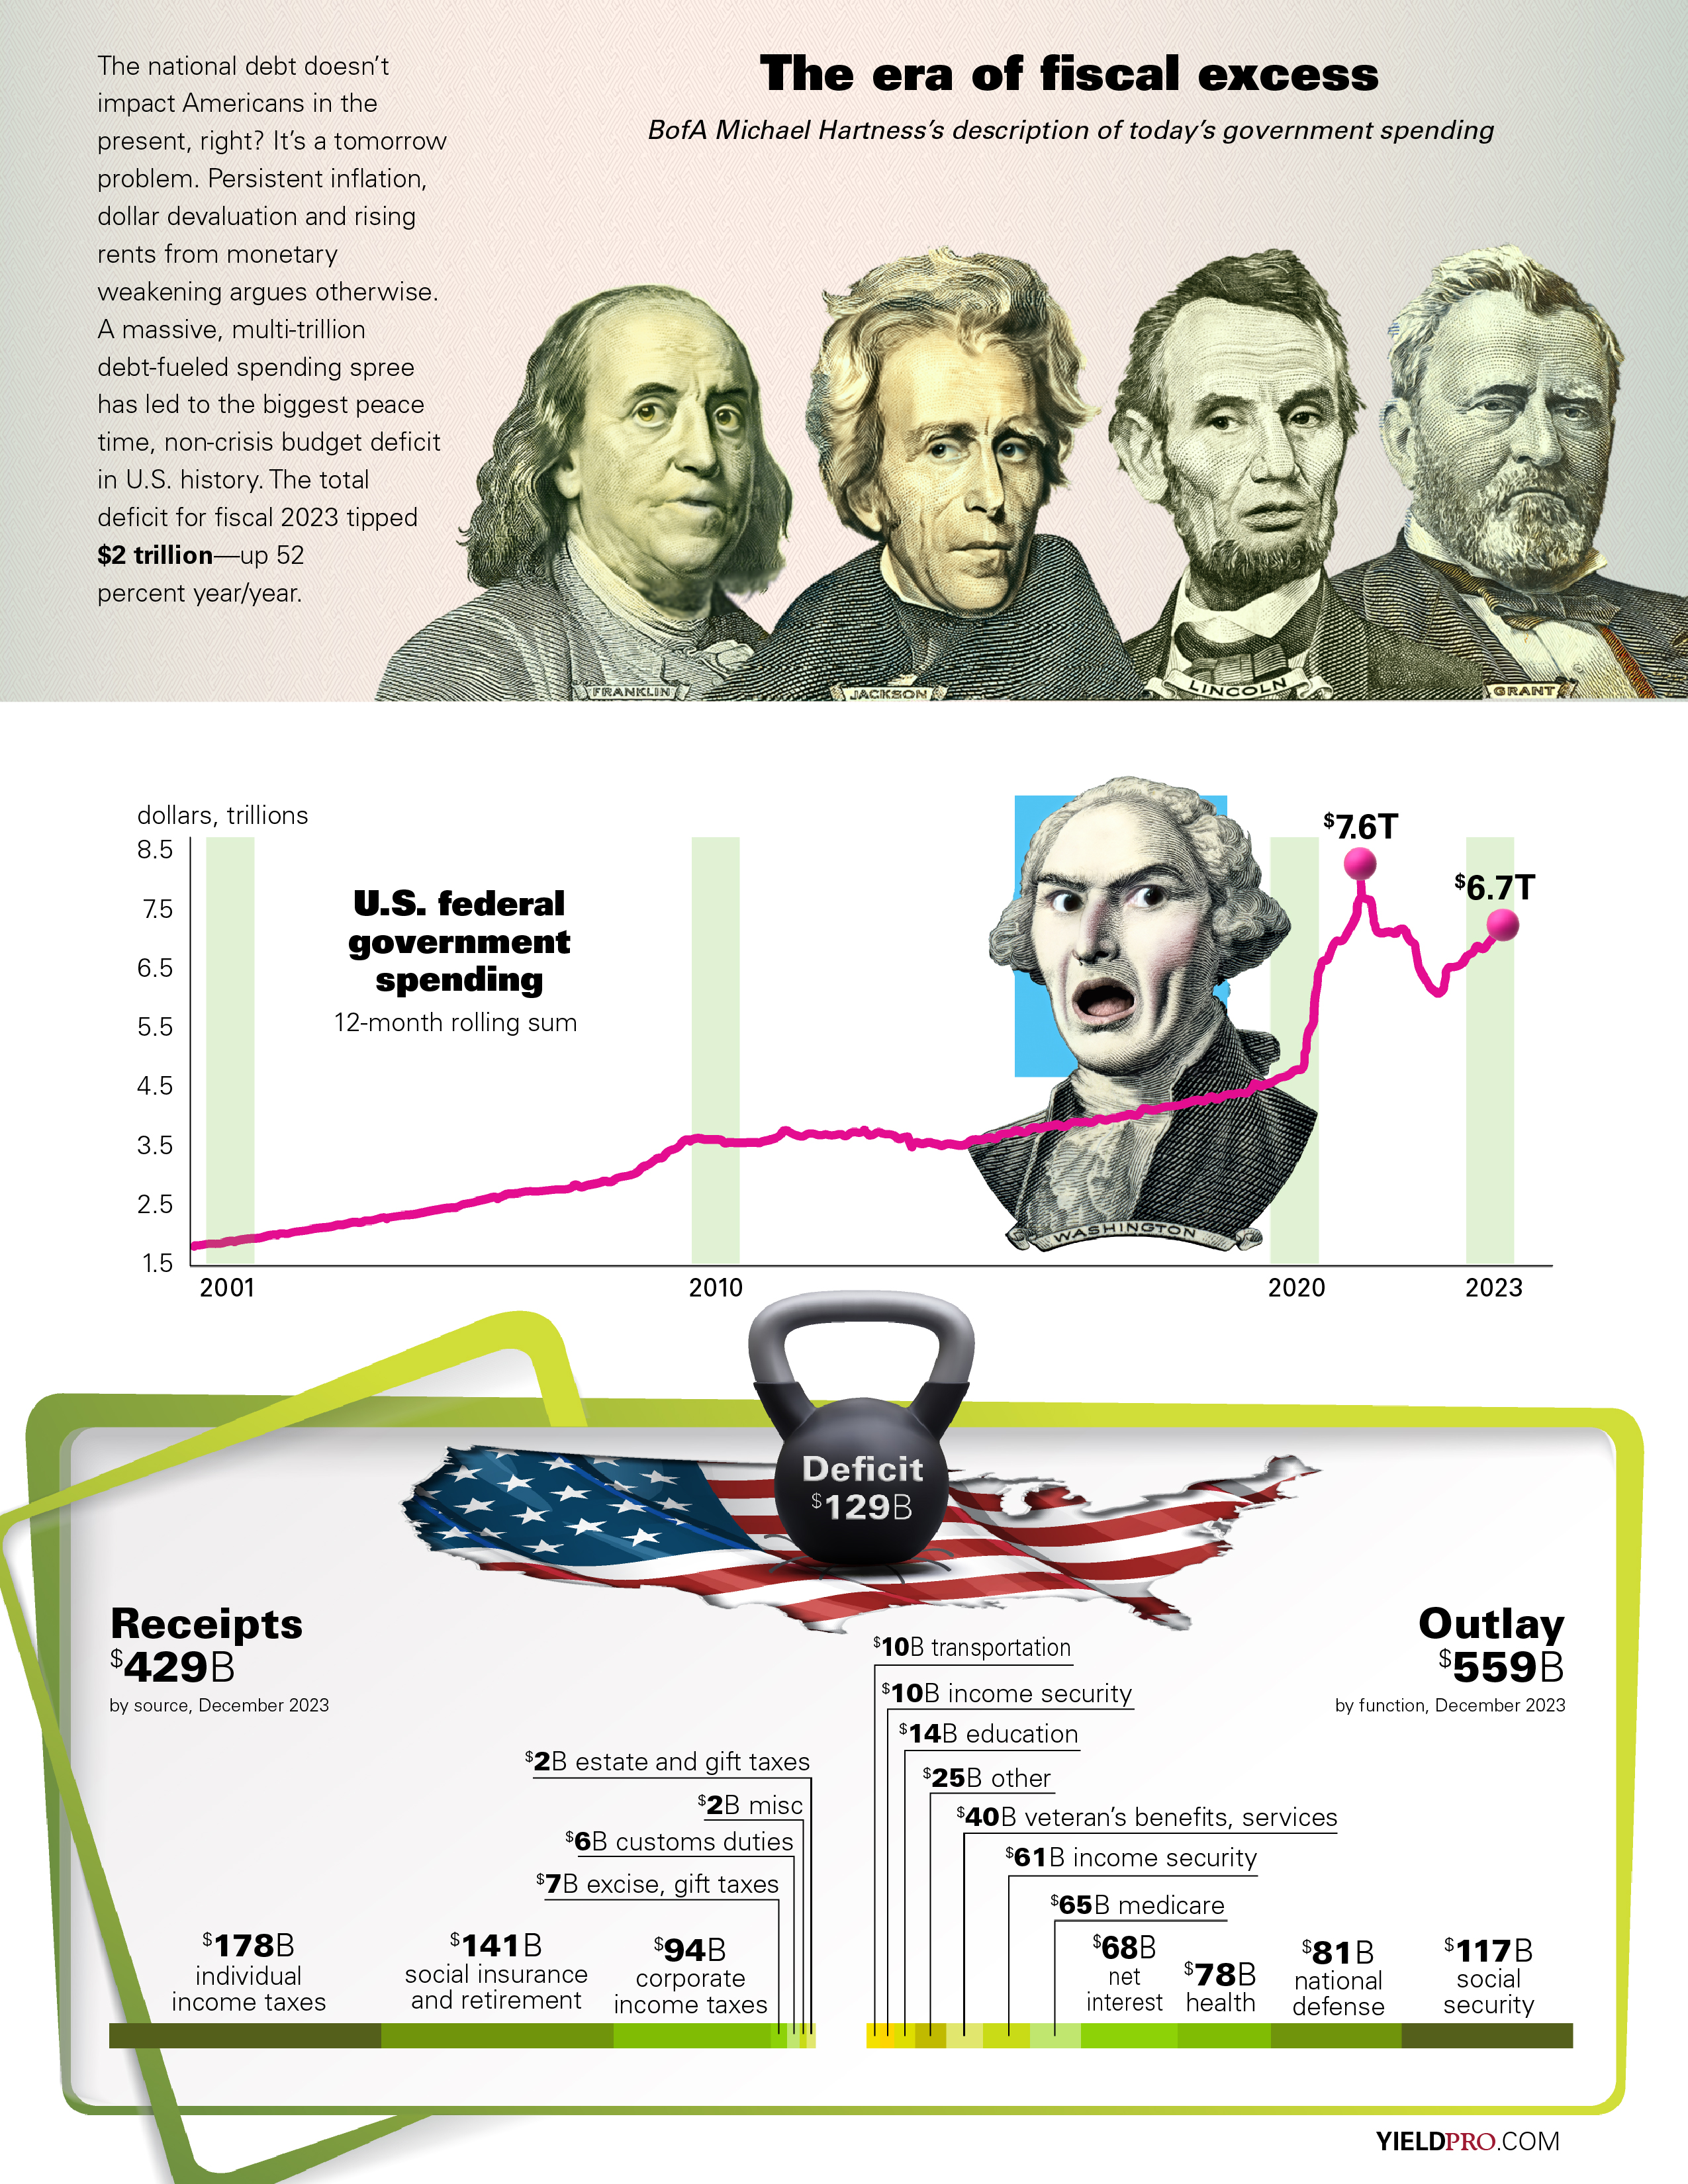
The national debt doesn’t impact Americans in the present, right? It’s a tomorrow problem. Persistent inflation, dollar devaluation and rising rents from dollar devaluation and monetary weakening argues otherwise. A massive, multi-trillion debt-fueled spending spree has led to the biggest peace time, non-crisis budget deficit in U.S. history. The total deficit for fiscal 2023 tipped $2 trillion—up 52 percent year/year.
U.S. federal government spending 12-month rolling sum
2020 — $7.6T
2023 — $6.7T
Receipts $429B by source, December 2023
Outlay $559B by function, December 2023
Deficit — $129B
$178B individual income taxes
$141B social insurance and retirement
$94B corporate income taxes
$7B excise, gift taxes
$6B customs duties
$2B misc
$2B estate and gift taxes
$117B social security
$81B national defense
$78B health
$68B net interest
$65B medicare
$61B income security
$40B veteran’s benefits, services
$25B other
$25B other
$25B other
$10B income security$10B transportation
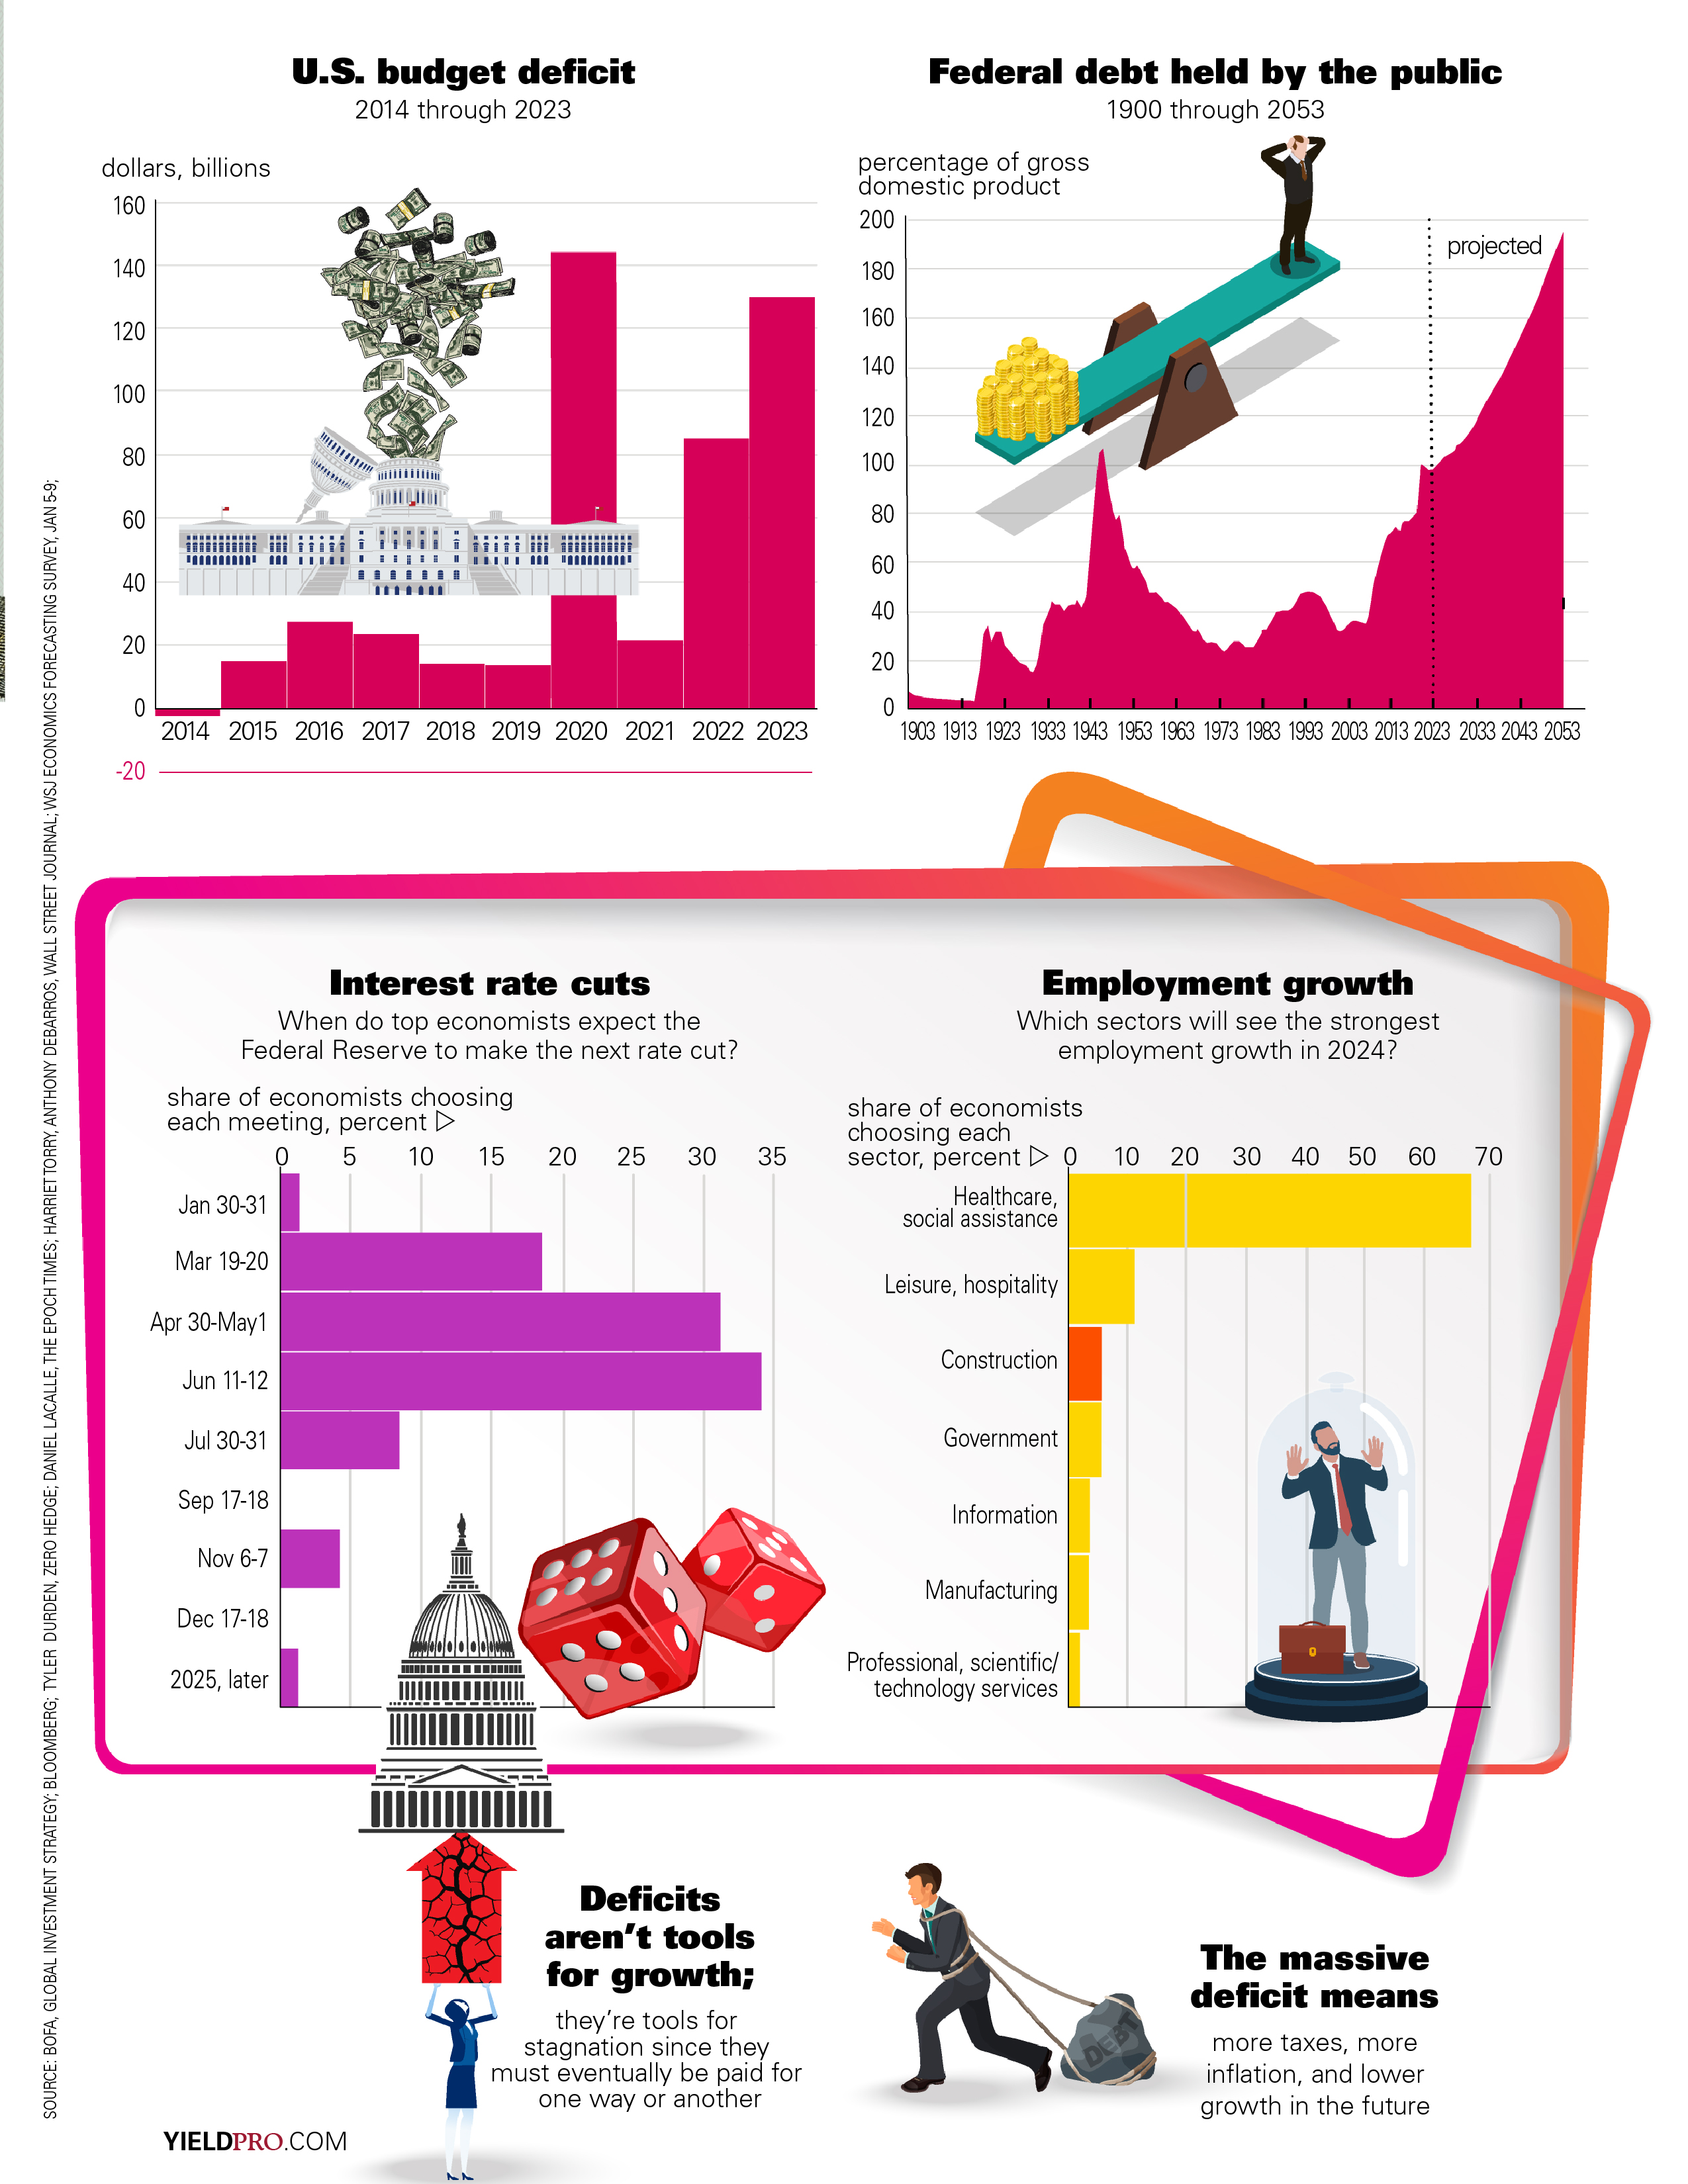
U.S. budget deficit, 2014 through 2023, dollars, billions (chart)
Federal debt held by the public, 1900 through 2053, percentage of gross domestic product (chart)
Interest rate cuts, When do top economists expect the Federal Reserve to make the next rate cut? share of economists choosing each meeting, percent (chart)
Employment growth, Which sectors will see the strongest employment growth in 2024? Share of economists choosing each sector, percent
Deficits aren’t tools for growth; they’re tools for stagnation since they must eventually be paid for one way or another
The massive deficit means more taxes, more inflation, and lower growth in the future
SOURCE: BOFA, GLOBAL INVESTMENT STRATEGY; BLOOMBERG; TYLER DURDEN, ZERO HEDGE; Daniel Lacalle, THE EPOCH TIMES; HARRIET TORRY, ANTHONY DEBARROS, WALL STREET JOURNAL; WSJ ECONOMICS FORECASTING SURVEY, JAN 5-9
PDF DOWNLOAD
The Era of Fiscal Excess


