

The latest commercial property price report from MSCI Real Capital Analytics said that multifamily property prices in January fell 0.4 percent from their level of the month before. Prices were down 7.9 percent from their level of one year before.
Defining CPPI
MSCI tracks an index called the Commercial Property Price Index (CPPI). The index is computed based on the resale prices of properties whose earlier sales prices and sales dates are known. The index represents the relative change in the price of property over time rather than its absolute price. Note that, as new properties are added to the MSCI dataset each month, they recalculate the CPPI all the way back to the beginning of the data series.
Apartment price growth revised lower
The first chart, below, shows how the CPPI’s for all commercial property as a single asset class and for apartments have changed since January 2016. To simplify the comparison, both CPPI’s have been normalized to values of 100 in January 2012. The chart also contains trend lines showing the straight-line average rates of price appreciation for the two asset classes based on their performances from January 2012 to December 2019.
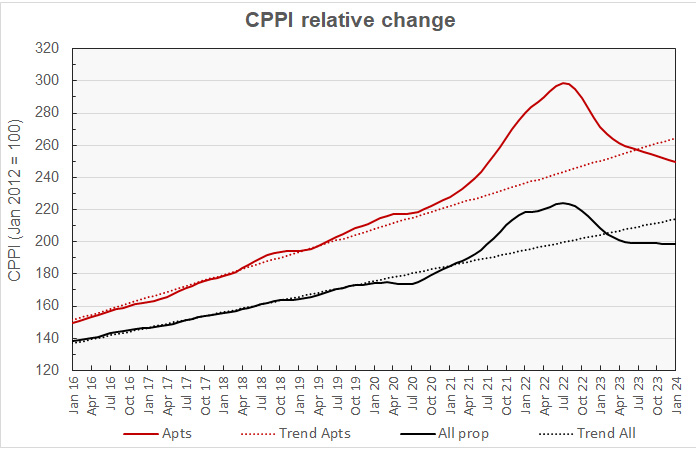
The chart shows that both multifamily property prices and prices for all commercial property are falling both in absolute terms and also relative to the pre-pandemic trend lines.
Multifamily property prices are now 17.4 percent above their level in January 2020 but 5.6 percent below their pre-pandemic trend. Prices for all commercial property are now 13.9 percent above their level in January 2020 but 7.4 percent below their pre-pandemic trend.
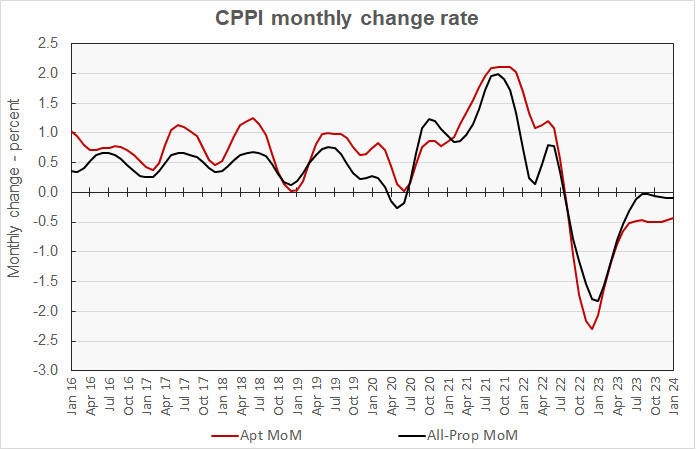
The next chart plots the month-over-month changes in the values of the CPPI since January 2016 for all commercial property as a single asset class and for apartments. The chart shows that prices for both classes of property fell for the month, with multifamily property prices falling at a faster rate than prices for all commercial property as a single asset class.
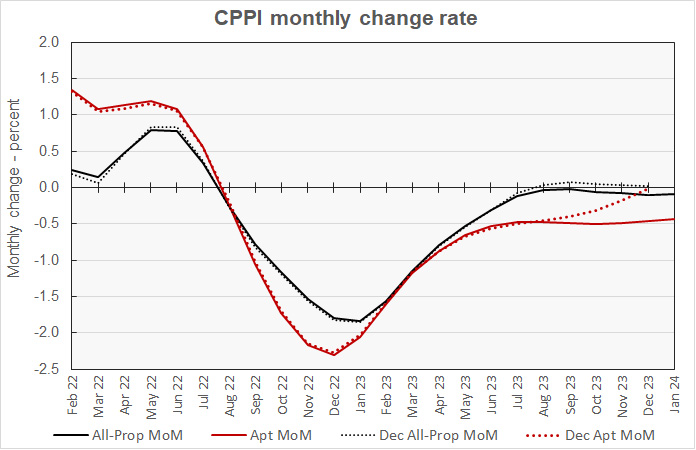
MSCI recalculates the CPPIs as more data arrives and the effects of these recalculations are illustrated in the next chart. The chart zooms in on the CPPI history since 2022 and includes last month’s data along with this month’s data. Changes to the data for both property classes in the latest report negatively impacted their recent reported rates of growth. The change to multifamily property prices was larger and effectively reversed the revisions made to the pricing data in last month’s report.
Industrial leads in price growth
Looking at other classes of commercial real estate, on a month-over-month basis, the industrial property class was joined by the retail property class in seeing their prices rise in January. Industrial property prices rose 0.2 percent while retail property prices eked out a 0.1 percent gain. Prices for office properties within central business districts (CBDs) fell 1.0 percent for the month while prices for suburban offices fell by 0.4 percent.
Industrial property was again the best performing on a year-over-year basis, managing a gain of 1.4 percent. Prices for offices within CBDs were down 28.9 percent while prices for suburban offices fell 11.9 percent. Prices for retail property were down 3.6 percent.
Commercial property price growth varies by metro size
The MSCI report provides data comparing the price changes of commercial property in 6 major metro* areas against those in the rest of the country, although it does not separate out apartments from other commercial property types in this comparison. The next chart, below, plots the history of the relative price indexes since January 2016 for both market segments, along with trend lines based on straight-line fits to the changes in these indexes between January 2012 and December 2019. For purposes of this chart, both price indexes were set to a value of 100 for January 2012.
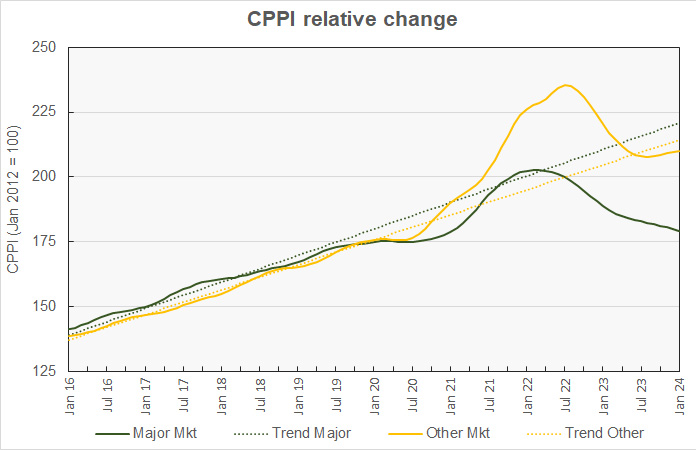
The chart shows that prices of commercial property in the 6 major metros were falling behind their pre-pandemic trend line as early as the fall of 2019. By the time the pandemic broke out in March 2020, major metro prices were already 3.5 percent below trend, while prices in non-major metros were only 0.8 percent below trend.
The CPPI for major metro commercial property is now only 2.6 percent above its level in January 2020 and 18.8 percent below its long-term trend. By contrast, the CPPI for property in other metros is now 19.6 percent above its level in January 2020 and only 2.0 percent below pre-pandemic trend.
The final chart plots the history of the month-over-month changes in the price indexes for the two property markets since January 2016. The chart shows that month-over-month price appreciation for major metros has been around -0.3 percent for the last 8 months. The chart also shows that price appreciation for the other metros has been positive for the last 5 months, although its rate of appreciation has been edging downward for the last 2 months.
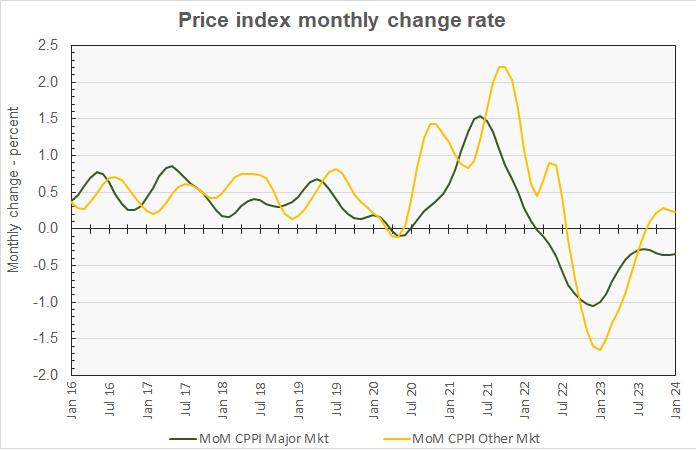
By the numbers, price appreciation for commercial property in major metros was reported to be -0.3 percent for the month and -5.0 percent for the year. Price appreciation for commercial property in non-major metros was reported to be +0.2 percent month-over-month but -4.6 percent year-over-year.
The full report provides more detail on other commercial property types. Access to the MSCI report can be obtained here.
*The major metros are Boston, Chicago, Los Angeles, New York, San Francisco and Washington DC.


