

Yardi Matrix reported that national average apartment rent was up $1 in February compared to the revised level of the month before at $1,713 per month. The national average year-over-year apartment asking rent growth was 0.6 percent in January, up 0.1 percent from the rate reported last month.
Rents in the “lifestyle” asset class, usually Class A properties, were down 0.6 percent year-over-year, while rents in “renter by necessity” (RBN) properties increased by 1.9 percent year-over-year. The chart, below, shows the history of the year-over-year rent growth rates for these two asset classes along with the difference between these rates.
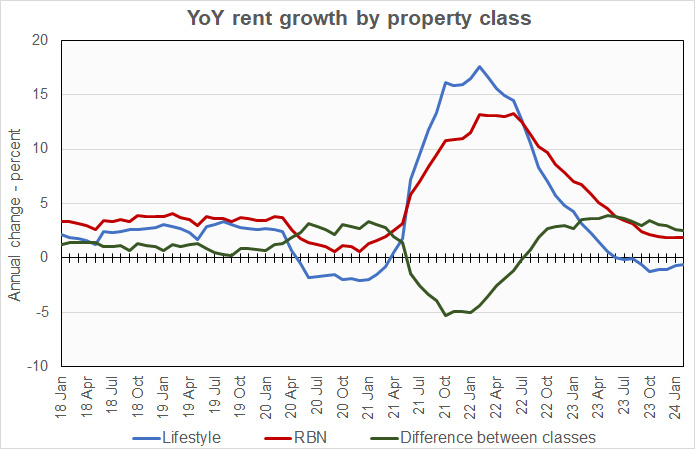
The chart shows that the year-over-year rent growth rates for both property classes are below those seen in the runup to the pandemic. The differences between their rent growth rates are also much larger than those seen in the pre-pandemic period.
The national average lease renewal rate was 64.8 percent in January, fully 1.8 percentage points below the rate in January. New Jersey continued to be the leader in lease renewal rate with 82.2 percent of renters renewing. Philadelphia remained in second place with a lease renewal rate of 77.7 percent. These rates are up marginally from those reported last month. Miami, Columbus and Baltimore also had lease renewal rates above 70 percent. At the other end of the spectrum, the lease renewal rate was only 45.3 percent in Los Angeles and 50.2 percent in San Francisco. These rates are down marginally from those reported last month.
Year-over-year rent growth for leases that were renewed was 4.6 percent in January, down 0.5 percentage points from the rate in last month’s report. As usual, individual metros varied significantly from the average. Year-over-year renewal rent growth was as high as 9.5 percent in Boston and as low as -1.2 percent in Austin.
Yardi Matrix reported that U.S. average occupancy rate dropped 0.1 percentage point in January to 94.5 percent. In February, the only one of the 30 metros on which Yardi Matrix reports which saw occupancy rise during the month was San Francisco, a rental market that was hit especially hard by Covid.
Yardi Matrix also reported that single-family rental (SFR) rents fell $2 in February from the revised level of the month before to $2,133 per month. The year-over-year SFR rent growth rate fell to 1.2 percent. Of the 34 metros tracked, 24 saw rents rise year-over-year.
The national occupancy rate for single-family rentals in January fell 0.1 percentage point from the level reported last month to 95.6 percent.
Tabulating the data
Yardi Matrix reports on other key rental market metrics in addition to rent growth. These include the average rent to income ratio, the rent growth rate for residents who renew their leases and the portion of residents who renew. The metro averages are included in the tables below, but the report also includes the rent to income ratios for both lifestyle and for RBN properties.
Of the Yardi Matrix 30 metros, the 10 with the largest annual apartment rent increases are listed in the table below, along with their annual percentage rent changes, overall rent to income ratio, rent growth for renewed leases and renewal rate for the month. The data on asking rent growth and rent-to-income ratios are for February. The other data are for January.
| Metro | YoY asking rent growth % | Rent to income ratio % | YoY renewal rent growth % | Monthly lease renewal rate % |
| New York | 5.4 | 27.3 | (1.0) | 68.7 |
| New Jersey | 3.8 | 28.1 | 5.2 | 82.2 |
| Columbus | 3.6 | 27.2 | 4.5 | 70.4 |
| Kansas City | 3.3 | 25.4 | 8.0 | 68.1 |
| Chicago | 3.1 | 30.8 | 6.3 | 65.9 |
| Indianapolis | 3.0 | 26.3 | 6.3 | 67.6 |
| Boston | 2.8 | 29.2 | 9.5 | 66.6 |
| Washington DC | 2.8 | 34.5 | 3.1 | 61.8 |
| Twin Cities | 2.1 | 28.1 | 1.4 | 66.1 |
| Philadelphia | 2.0 | 30.0 | 5.0 | 77.7 |
Yardi Matrix reports most of its statistics for New Jersey for the state as-a-whole. However, it reports rent-to-income data for Northern New Jersey and for Central New Jersey as separate locales. The rent-to-income value for New Jersey listed above is the average of the Northern and Central values.
The major metros with the smallest year-over-year apartment rent growth as determined by Yardi Matrix are listed in the next table, below, along with the other data as in the table above.
| Metro | YoY asking rent growth % | Rent to income ratio % | YoY renewal rent growth % | Monthly lease renewal rate % |
| Austin | (6.2) | 26.7 | (1.2) | 58.2 |
| Phoenix | (3.2) | 28.0 | 2.1 | 63.0 |
| Atlanta | (3.1) | 28.9 | 5.6 | 65.9 |
| Orlando | (3.0) | 31.9 | 7.0 | 68.0 |
| Raleigh | (3.0) | 27.0 | 3.4 | 67.3 |
| Portland | (2.6) | 30.8 | 4.1 | 62.5 |
| Nashville | (1.9) | 29.8 | 5.7 | 63.2 |
| Dallas | (1.6) | 27.1 | 3.7 | 63.5 |
| Charlotte | (1.5) | 28.3 | 1.7 | 63.7 |
| Tampa | (1.1) | 30.7 | 4.3 | 67.1 |
The top metros for month-over month rent growth in January were New York City, Miami, Chicago and Columbus. The metros with the lowest month-over-month rent growth were Austin, Raleigh, Phoenix and San Diego.
SFR markets
Yardi Matrix reported on the top 34 metros for single family rentals. The leading metros for year-over-year rent growth were Boston, Raleigh, Orange County and Indianapolis.
This month, 15 of the metros saw year-over-year occupancy increases. The metros with the largest year-over-year occupancy increases were Washington D.C., Tampa, Houston and Las Vegas. The metros with the greatest occupancy declines were Philadelphia, Atlanta, Orlando and Los Angeles.
The complete Yardi Matrix report provides information on some of the smaller multifamily housing markets. It also has more information about the larger multifamily markets including numbers on job growth and on completions of new units. It can be found here.


