

CoStar reported that its value-weighted index of multifamily property prices fell 1.4 percent month-over-month in February 2024, the sixth decline in a row and the 17th decline in the last 19 months. This index was down 10.5 percent year-over-year.
The value-weighted index of non-multifamily commercial property fell 1.0 percent month-over-month in February while last month’s reported increase was turned to a slight loss by newly identified transactions. This index fell 10.8 percent year-over-year. The other commercial property types tracked by CoStar are office, retail, industrial and hospitality.
For more information on the CoStar Commercial Repeat Sales Indexes (CCRSI’s), please see the description at the bottom of this report.
YoY multifamily property prices decline
The first chart, below, shows the history of the value-weighted CCRSI’s since January 2016 for multifamily property and for all other commercial property considered as a single asset class. It also shows trend lines for the growth in the two CCRSI’s based on their growth in the period from January 2012 to January 2020. The indexes are normalized so that their values in December 2000 are set to 100.
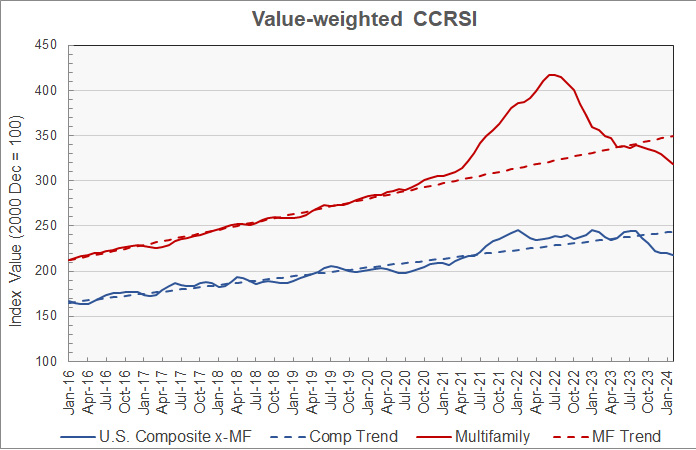
The chart shows that multifamily property prices are continuing to fall in absolute terms and also relative to their pre-pandemic trend. Multifamily property prices dropped from a revised level of 7.1 percent below trend last month to 8.8 percent below trend this month. This month’s rise in other commercial property prices caused them to reach 10.9 percent below pre-pandemic trend from a revised level of 9.7 percent below trend last month.
The second chart shows the year-over-year change in the value-weighted multifamily property price index and that for all other commercial property types since January 2016. It also shows the average rates of annual price growth for the two property classes since January 2012.
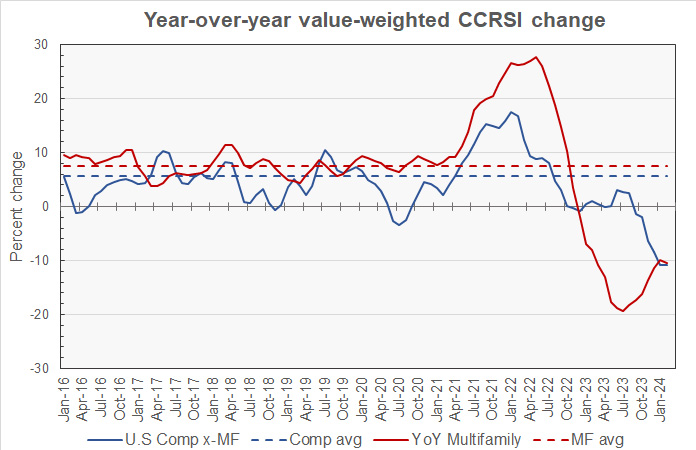
The chart shows that the rate of year-over-year declines in multifamily property prices had been moderating but that they took a turn this month, increasing the rate of decline slightly. The rate of year-over-year declines in non-multifamily property prices had been accelerating but the growth in the rate of decline lessened slightly this month.
Since January 2012, the average annual increase in multifamily property prices has been 7.6 percent while that of other commercial property prices has been 5.7 percent.
Transaction volumes continue to fall
An issue with monthly transaction volume reporting is that CoStar usually identifies additional transactions to tabulate over the next few months after the initial report, and these extra transactions tend to make initial reports of declining transaction volumes appear worse than they eventually turn out to be.
CoStar reported that the initial transaction count for February was down again from that of the prior month at 803 transactions. This was the lowest transaction count reported since May 2020 when COVID lockdowns were in place. However, the February transaction count is likely to be revised higher in next month’s report so this comparison may not stand.
Last month’s transaction count was revised higher by 14.0 percent as 129 additional transactions were identified for January. On an initial report to initial report basis, transactions were down 13.0 percent for the month. However, comparing the transaction count for February to the updated transaction count for January results in a drop of 23.7 percent.
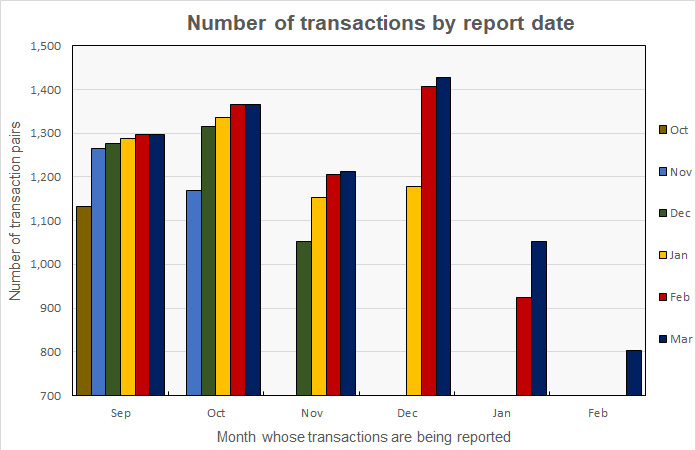
The effect of CoStar’s transaction count revisions is shown in the next chart, below. The cluster of bars at the left side of the chart represent the 6 reports that have been made so far as to the volume of transactions for September 2023. The preliminary volume for September 2023 reported in October was 1,132 transactions. This count was revised to 1,266 transactions in the November report and to 1,277 transactions in the December report. The current (February) report puts the September transaction count at 1,296. The 14.5 percent additional transactions identified between October and March can change the assessment of how September’s transaction volume stacks up against that of any month to which it is being compared.
The preliminary dollar volume of transactions was reported to fall 11.1 percent from the revised level of the month before to $5.2 billion. However, it was up 3.2 percent from the preliminary level reported last month.
Distress bucks the trend
CoStar’s also reported on the portion of sales that would be considered “distressed”. The next chart shows the distressed sales trend. Because of volatility in the data, it presents the 3-month weighted moving average of CoStar’s distressed sales data. Note that CoStar does not break out what portion of sales used to calculate their index of multifamily property prices are considered distressed.
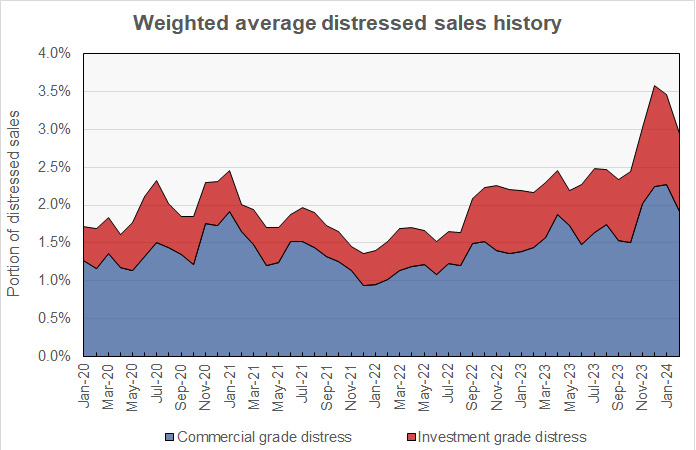
The chart shows that the portion of sales that CoStar designates as distressed was on an upward trend from about December 2022 to December 2023. However, data from the last two months identified a lower percentage of sales as distressed. Raw data for February places distressed sales at 2.5 percent of total sales while the 3-month weighted moving average puts the portion of distressed sales at 2.9 percent.
The full report discusses all commercial property types. While the CoStar report provides information on transaction volumes, it does not break out multifamily transactions. The latest CoStar report can be found here.
CCRSI defined
The CoStar report focuses on a relative measure of property prices called the CoStar Commercial Repeat Sales Index (CCRSI). The index is computed based on the resale of properties whose earlier sales prices and sales dates are known. The index represents the relative change in the price of property over time rather than its absolute price. CoStar identified 803 repeat sale pairs in February for all property types. These sales pairs were used to calculate the results quoted here.
CoStar computes CCRSI’s for a variety of property groupings, combining them by cost, region, property type or other factors. The value-weighted index is more heavily influenced by transactions of expensive properties than is CoStar’s equal-weighted index. The value-weighted index is the focus of this report because it is an index whose value is reported monthly and for which CoStar breaks out multifamily property as a separate category.


