

The latest rent report from Apartment List shows that the national median monthly rent growth in May was +0.5 percent. However, year-over-year rent growth was -0.8 percent. Rents have now fallen on a year-over-year basis for an entire year.
Apartment List reported the national median apartment rent to be $1,404, up $7 from last month’s revised figure.
Charting the data
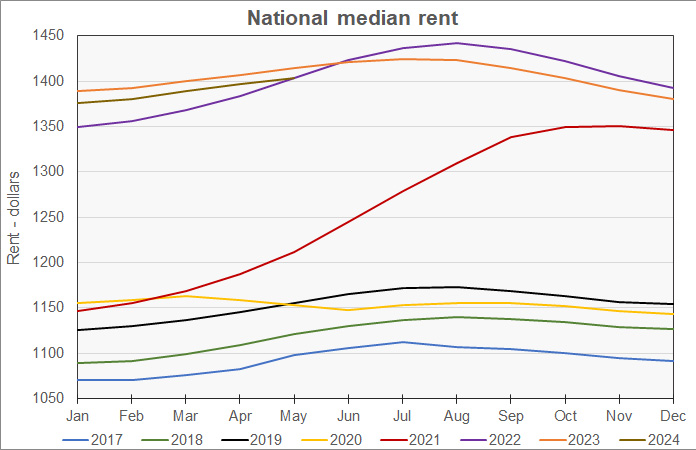
The first chart shows the history of the national median rent level since 2017. It is plotted year-by-year so that the annual change pattern is visible. The chart shows that rents in 2024 are tracking at a pretty consistent fraction below those in 2023.
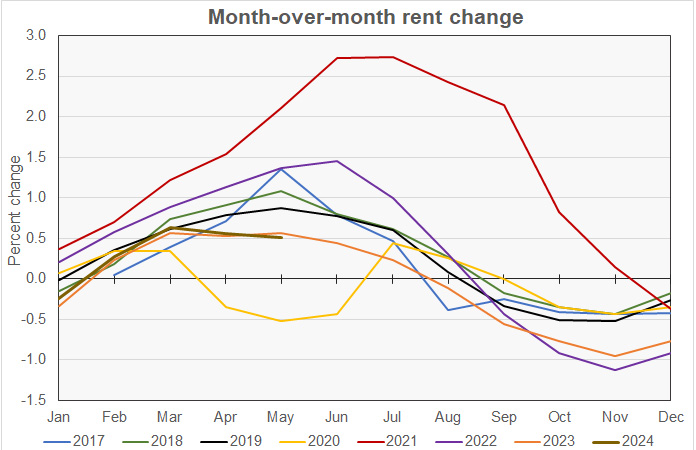
The next chart shows the rate of month-over-month rent growth, again plotted by year so that the annual pattern is visible. The chart shows that the last two years have seen the lowest rate of month-over-month rent growth in the Apartment List data set except for the pandemic year of 2020.
The next chart shows the year-over-year rate of rent growth since January 2018 plotted along with the national median apartment vacancy rate.
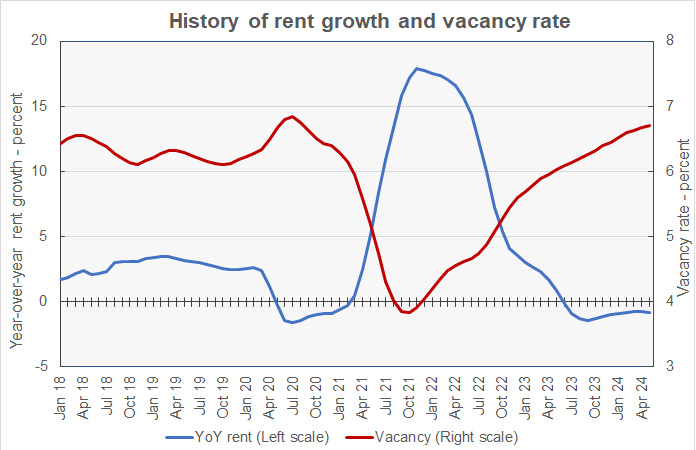
The chart shows that the national average vacancy rate is continuing to rise, albeit slowly. The current vacancy rate of 6.7 percent rounds to the same figure as last month’s rate, but it is fractionally higher when viewed to more decimal places. It is up slightly from the 6.5 percent average vacancy rate for May in the pre-pandemic years of 2017 through 2019. It is also higher than the overall average vacancy rate of 6.4 percent seen in the three years before the pandemic.
The chart also shows that current string of months with negative year-over-year rent growth is now longer than that seen during the pandemic.
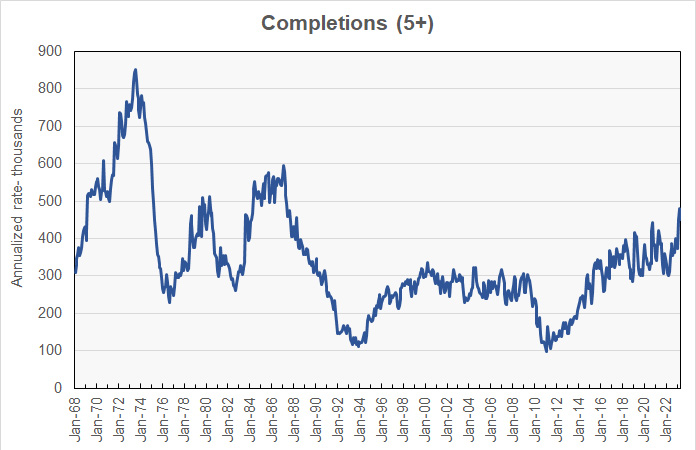
A factor driving the vacancy rate upward is the high number of apartment units being delivered. This is illustrated in the next chart which shows the number of units completed by month since 1968 in buildings with 5 or more units. The data is shown on a three month moving average basis in order to smooth out some of the data noise. The chart shows that recent completions are at their highest levels since the late 1980’s.
The final chart shows the change in the national median apartment rent since January 2017 in nominal dollar terms along with two other measures of rent accounting for changes in income and price levels. The Income adjusted curve adjusts the rent by the change in average hourly earnings as reported by the Bureau of Labor Statistics. The Inflation adjusted curve adjusts the rent by the general change in price level as measured by the not-seasonally-adjusted Consumer Price Index for all urban consumers (CPI-U).
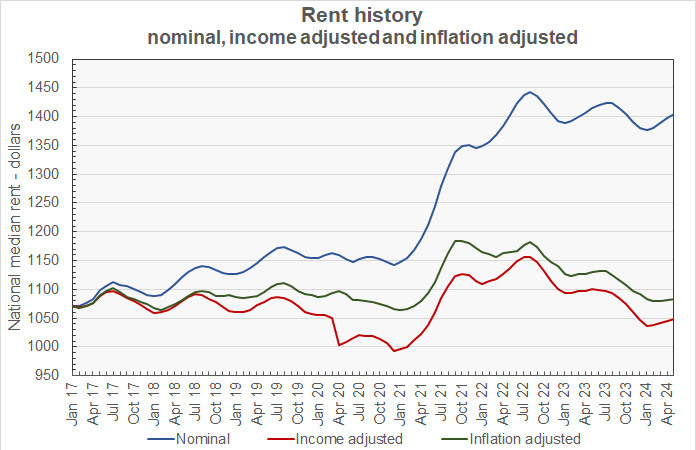
The curves show that, while rents have soared in nominal terms, when adjusted for wage growth or for the general increases in prices, they are close to their pre-pandemic levels. Since January 2017, average rents are up 31.1 percent while average hourly earnings are up 33.9 percent and inflation as measured by the CPI-U is up 29.6 percent.
Ranking the metros
Apartment List provides the underlying data they collected in compiling their report and that data was used to create the tables, below. The tables look at the 50 most populous metropolitan statistical areas defined by the US Census Bureau and identify the top and bottom 10 metros for year-over-year rent growth. The tables provide the median monthly rent in the metro, the metro’s vacancy rate, the annual percentage change in rent (YoY Metro) along with the percentage change from the prior month’s rent level (MoM Metro). They also list the percentage changes in rent for the metro areas compared to the rent levels in February 2020, right before the pandemic struck (Feb 20).
The first table shows the 10 metros with the largest annual rent percentage increases. Many of these cities are in the northern “rust belt”.
| Metro | Metro Rent | Vacancy rate | YoY Metro | MoM Metro | Feb 20 |
| Louisville | $1,220 | 5.0 | 5.3 | 1.32 | 26.7 |
| Hartford | $1,535 | 4.7 | 5.3 | 1.01 | 32.3 |
| Providence | $1,455 | 4.6 | 5.0 | 1.49 | 38.6 |
| Milwaukee | $1,223 | 5.3 | 4.3 | 1.12 | 25.4 |
| Cleveland | $1,093 | 5.5 | 3.7 | 1.33 | 26.8 |
| Washington | $2,160 | 5.3 | 3.3 | 1.00 | 16.4 |
| Grand Rapids | $1,229 | 8.0 | 3.2 | 0.21 | 33.2 |
| Kansas City | $1,314 | 6.3 | 3.1 | 1.67 | 25.5 |
| Detroit | $1,216 | 4.8 | 2.9 | 1.57 | 21.6 |
| Virginia Beach | $1,554 | 5.0 | 2.9 | 0.69 | 31.5 |
The next table shows the 10 metros with the smallest annual rent increases. Many of these cities are seeing high levels of new product coming to market.
| Metro | Metro Rent | Vacancy rate | YoY Metro | MoM Metro | Feb 20 |
| Austin | $1,446 | 9.3 | (7.3) | 0.21 | 14.5 |
| Raleigh | $1,448 | 8.6 | (4.5) | 0.29 | 24.3 |
| Atlanta | $1,482 | 7.5 | (4.4) | (0.03) | 20.8 |
| San Antonio | $1,247 | 8.5 | (4.3) | 0.10 | 15.9 |
| Orlando | $1,581 | 6.8 | (3.6) | 0.55 | 26.3 |
| Jacksonville | $1,397 | 6.8 | (3.5) | 0.30 | 26.5 |
| Charlotte | $1,364 | 8.2 | (3.4) | 0.29 | 22.0 |
| Phoenix | $1,448 | 7.3 | (2.8) | 0.10 | 25.3 |
| Nashville | $1,420 | 7.8 | (2.7) | 0.61 | 22.1 |
| Dallas | $1,479 | 8.0 | (2.6) | 0.08 | 21.1 |
In May, 25 of the 50 most populous metros saw their rents rise on a year-over-year basis. In addition, 49 metros saw rents rise on a month-over-month basis. San Francisco is again the only metro of the top-50 that has rents that are below their level in February 2020, immediately before the pandemic.
The complete Apartment List report covers many more metros and also provides city, county and state data. It gives readers with the opportunity to download their data sets. The latest report can be found here.


