

Trepp reported that delinquency rate for multifamily commercial mortgage-backed securities (CMBS) loans fell in April, declining 51 basis points.
Overall CBMS delinquency rate higher
For delinquencies, Trepp focuses on loans that are 30 or more days delinquent. The current CMBS delinquency report provides data through April 2024. While it only looks at CMBS loans, it breaks out results by the type of property covered by the loans.
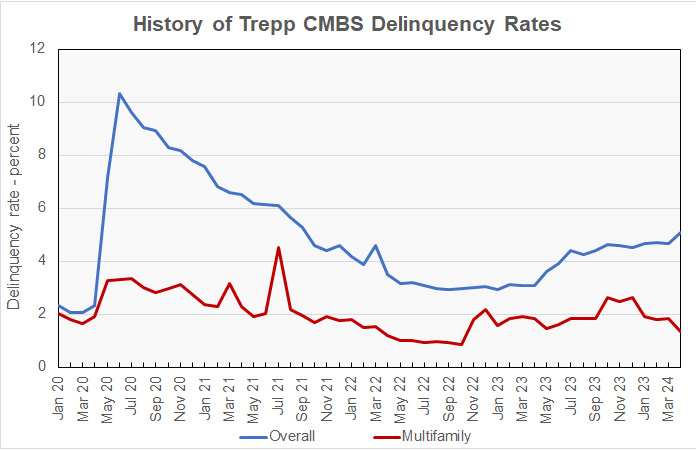
The delinquency rate on loans on multifamily property was 1.33 percent, down from 1.84 percent in March and down from 1.81 percent in February. One year ago, the delinquency rate on CMBS loans for multifamily property was 1.82 percent.
Trepp found that the overall delinquency rate of CMBS loans in April was 5.07 percent. This is up 40 basis points from last month’s level of 4.67 percent.
The report noted that loans that are past their maturity date but are still current on their interest payments are not counted as being delinquent. However, if they were included, the overall delinquency rate on CMBS loans would rise to 5.29 percent from the 5.07 percent reported above.
The history of the overall and multifamily CMBS delinquency rates as reported by Trepp since January 2020 is illustrated in the chart, below.
Office, lodging and retail all weaken
The other property types whose CMBS loan delinquencies were examined by Trepp were industrial, lodging, office and retail.
The CMBS delinquency rate for loans on industrial property fell to 0.44 percent, down slightly from 0.47 percent reported last month. Office CMBS delinquencies rose 80 basis points to 7.38 percent. Delinquencies on CMBS loans for lodging properties rose 52 basis points to 5.97 percent. Delinquencies on CMBS loans on retail properties rose 38 basis points to 5.94 percent.
Loan loss severity rises
Trepp also reported on the volume and severity of loan losses on CMBS loans which were resolved in April, although it does not break down the data by the type of property covered by the loans. The history of this data since January 2023 is shown in the next chart. The chart shows the average loss incurred per resolved loan along with the percentage of the loan’s value that was lost during resolution.
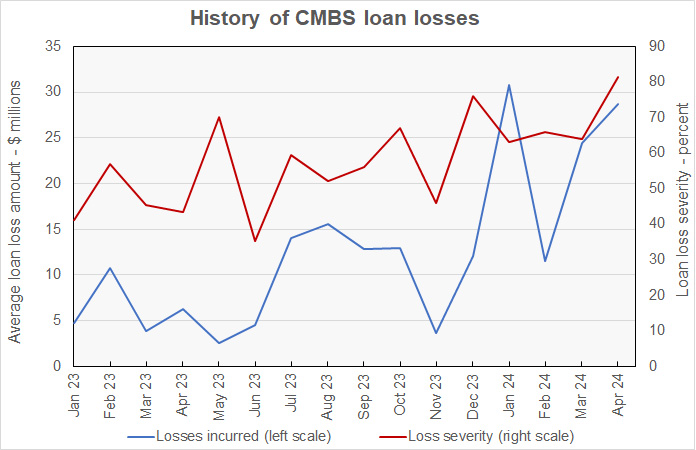
The chart shows that the severity of CMBS loan losses increased to 81.5 percent in April with an average loss per loan of $28.7 million. Only 3 loans resolved during the month, down from 13 that resolved the month before.
For reference, between 2010 and 2019, the average loss severity on CMBS loans was 41.2 percent. The average loss per loan during that time period was $5.4 million.
The full Trepp delinquency report can be found here. The April loan loss severity report can be found here.


